
Figures & data
Figure 1. Rational approach to design phenyl-substituted indole-fused benzooxazepines (1a-16a).
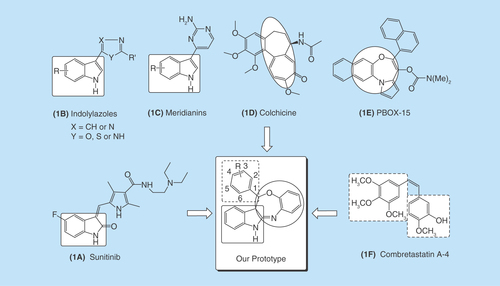
Figure 2. One-pot three-component-efficient synthetic route to the title compounds (1a–16a).
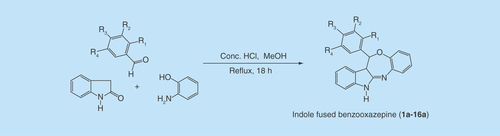
Figure 3. The plausible reaction mechanism for the title compounds (1a–16a).
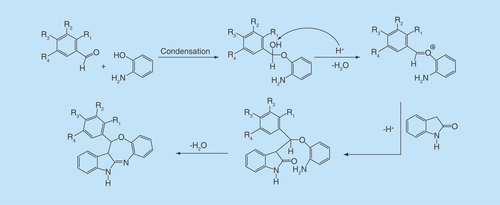
Figure 4. Docking complex of 14a with IL-6.
(A) Structural conformational changes before MD simulation. (B) Structural conformational changes after MD simulation: Back bone of active site domain complex, which indicates the contraction of ligand with amino acids residue.
MD: Molecular dynamic.
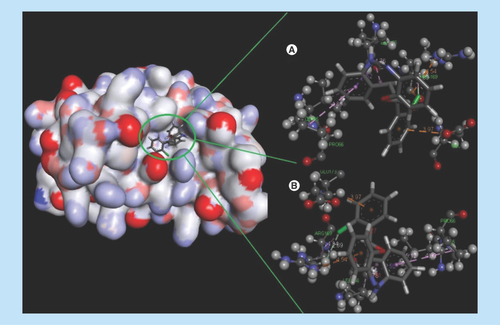
Figure 5. The stability profile of ligand–protein complex under the molecular dynamic simulation.
(A) Average RMSD versus time graph that indicates convergence of the simulated structure toward an equilibrium state with respect to a reference structure (starting structure). (B) Potential energy of complex versus time graph that indicates the stability of ligand–protein complex and (C) Binding energy of complex versus time graph that also indicates stability of ligand–protein complex.
RMSD: Root-mean-square deviation.
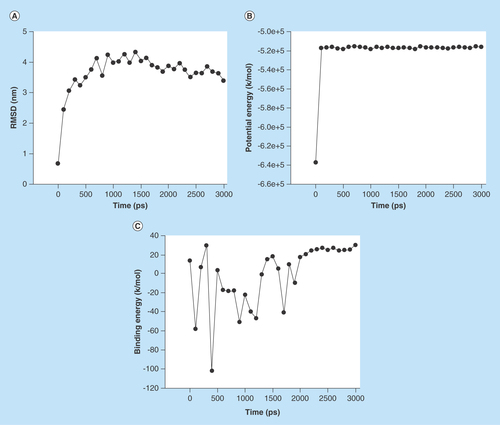
Table 1. In vitro cytotoxicity data of synthesized compounds against human hepatoma (Hep-G2) cancer cell lines.
Table 2. Docking affinity of active compounds with assigned anticancer receptors.
Table 3. Pharmacokinetic parameters important for oral bioavailability and protein-binding parameters of synthesized compounds.