Figures & data
Figure 1. MinoCard.
(A) Design of the cartridge. 1 – blister position, 2 – socket for a sample container, 3,5,6,8 – washing chambers (10 μl each), 4 – optionally washing or lysis chamber (20 μl), 7 – amplification chamber (50 μl), 9 – (optionally) hybridization chamber, 10 – waste chamber. T1–T4: positions of Peltier elements (on the external instrument). Ch1: 1.4 mm-wide channel, Ch2 – 0.4 mm-wide channel. (B) Attachment of a sample container (a syringe or a special container) to the socket.
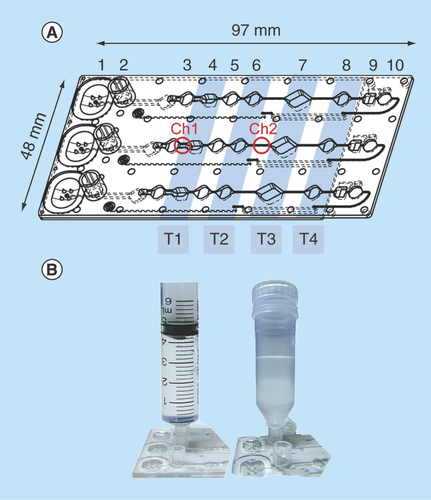
Figure 2. MinoLyzer.
(A) Schematic diagram of the modules of the MinoLyzer with the microfluidic cartridge. (B) The functional prototype of the instrument.
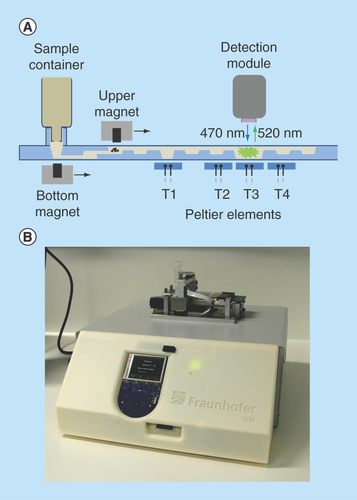
Figure 3. Detection of S. enteritidis via loop-mediated isothermal amplification performed after the immunomagnetic pathogen isolation.
(A) On-chip real-time optical detection. (B) Reference samples processed in LightCycler®.
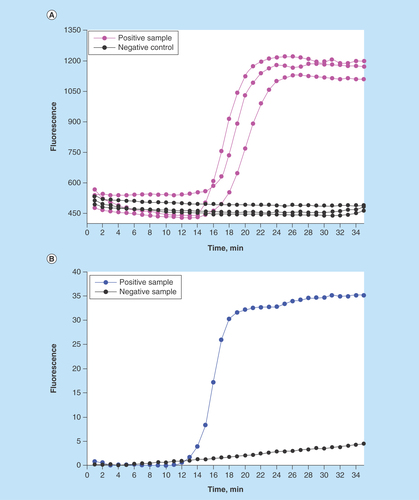
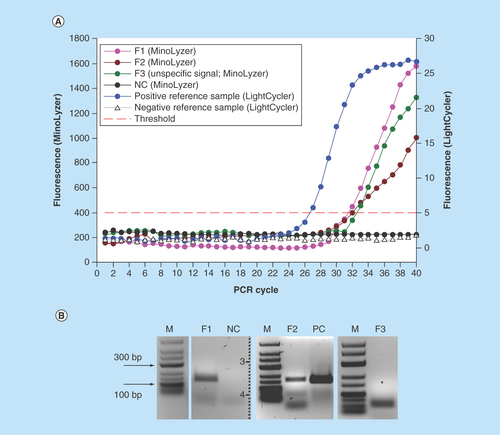
Figure 4. Detection of E. coli DNA after the immunomagnetic preconcentration, lysis and PCR on the chip.
(A) On-chip real-time optical detection. (B) Off-chip analysis of PCR products in gel electrophoresis.
S1-S3: Sample replicates; NC: Negative control (no template); PC: Positive control (0.5 ng E. coli DNA).
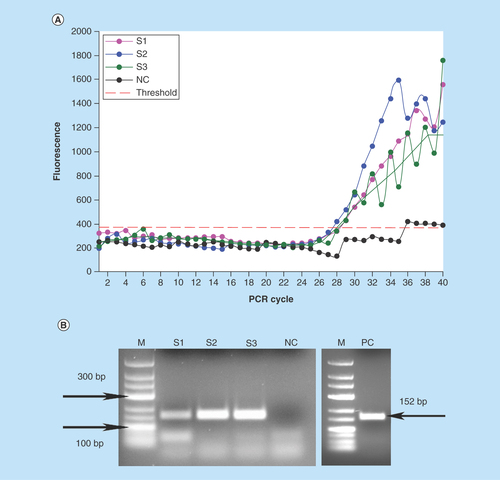
Figure 5. Generation of the pH gradient (referred to the color scale left) for the DNA binding, washing and elution in the valve-free cartridge.
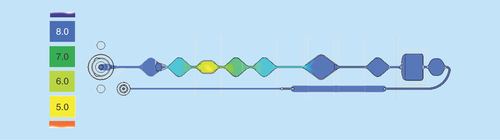
Figure 6. Detection of E. coli in the full assay (bacteria preconcentration, lysis, DNA purification and PCR) on the chip.
(A) On-chip real-time optical detection. (B) Off-chip analysis of PCR products in gel electrophoresis.
*Expected position of specific PCR product (152 bp).
F1–F3: Sample replicates; NC: Negative control (no template); PC: Positive PCR control in thermocycler (5 ng E. coli DNA).