
Figures & data
Figure 1. General schematic of a biosensor.
Classified based on immobilized biological elements as enzyme, nucleic acid or affinity biosensors.
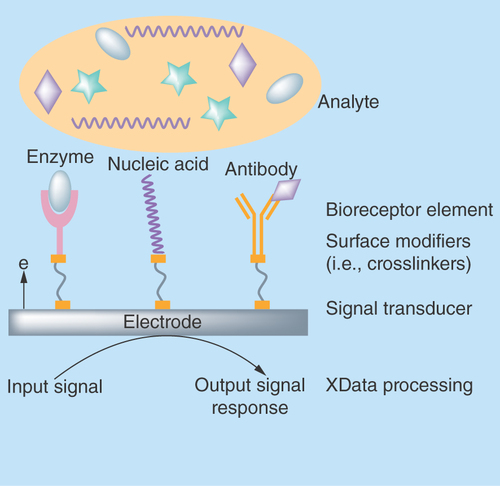
Figure 2. A schematic representation of non-central symmetry in ZnO in its wurtzite structure highlighting the polar and nonpolar planes.
sp3 tetrahedral coordination in ZnO is also illustrated.
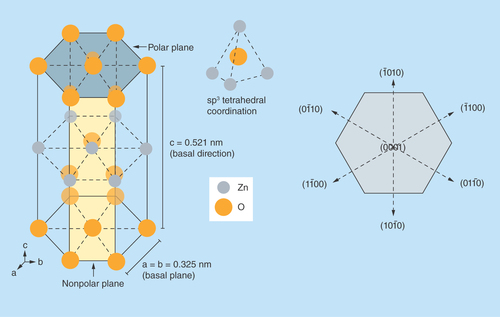
Figure 3. Growth morphologies of ZnO nanostructures.
Adapted with permission from [Citation29].
![Figure 3. Growth morphologies of ZnO nanostructures.Adapted with permission from [Citation29].](/cms/asset/e37a2029-b748-4dbb-9718-353843d3e559/ifso_a_12364027_f0003.jpg)
Figure 4. Illustration of covalent functionalization of sensing platform with a cross-linker molecule.
Adapted with permission from [Citation65].
![Figure 4. Illustration of covalent functionalization of sensing platform with a cross-linker molecule.Adapted with permission from [Citation65].](/cms/asset/d027fad1-9978-4b72-8bda-7e2e406f4573/ifso_a_12364027_f0004.jpg)
Figure 5. Illustration of charge and potential distribution at ZnO electrode/electrolyte interface.
Adapted with permission from [Citation80].
![Figure 5. Illustration of charge and potential distribution at ZnO electrode/electrolyte interface.Adapted with permission from [Citation80].](/cms/asset/82c10fa0-3d50-42bb-b1de-fe3abebad892/ifso_a_12364027_f0005.jpg)
Table 1. A summary of the electrical biosensors based on ZnO for detection of cardiac biomarkers.