Figures & data
Figure 1. Transmission electron microscopy of Paracoccidioides lutzii, whole membranes system fraction.
(A) Intact cells of P. lutzii. (B) Membranes extract. (C) Fragment of membrane, evidencing the lipid bilayer (increase of 40,000 times).
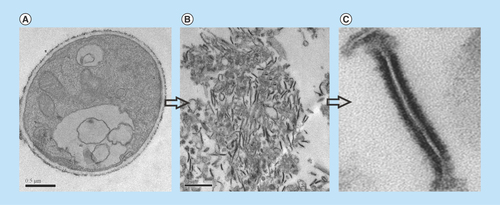
Table 1. The most abundant membrane proteins.
Figure 2. Functional classification of membrane proteins regulated by zinc availability.
The database FunCat2 was used to perform this classification. Light gray bars represent downregulated proteins and dark gray bars represent upregulated proteins. Proteins upregulated: Transport – 56% (10 proteins), Cell cycle and DNA processing – 0% (0 protein), Metabolism – 0% (0 protein), Cellular communication – 0% (0 protein), Protein synthesis – 6% (1 protein), Protein fate – 6% (1 protein), Biogenesis of cellular components – 0% (0 protein), Cell rescue – 6% (1 protein), Energy – 6% (1 protein), Unclassified – 17% (3 proteins), Cell-type differentiation – 0% (0 protein), Cell fate – 6% (1 protein). Proteins downregulated: Transport – 31% (36 proteins), Cell cycle and DNA processing – 2% (2 proteins), Metabolism – 14% (16 proteins), Cellular communication – 5% (6 proteins), Protein synthesis – 1% (1 protein), Protein fate – 10% (11 proteins), Biogenesis of cellular components – 5% (6 proteins), Cell rescue – 4% (5 proteins), Energy – 14% (16 proteins), Unclassified – 13% (15 proteins), Cell-type differentiation – 1% (1 protein), Cell fate – 0% (0 protein).
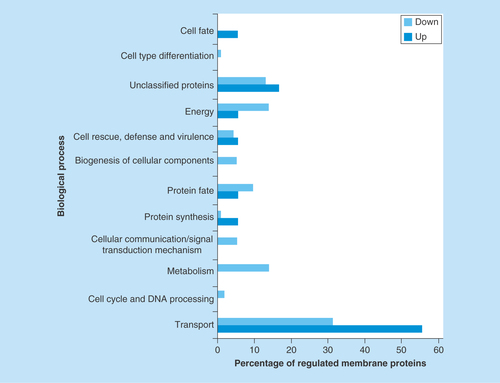
Figure 3. Effect of zinc deprivation in Paracoccidioides lutzii yeast cells wall.
Yeast cells were cultivated in MMcM medium depleted or supplemented with zinc for 24 h. (A) The cells were fixed and stained with CFW (increase of 40 times). (B) Fluorescence intensity (in pixels) of the cells under zinc deprivation. The AxioVision Software (Carl Zeiss) was used to obtain the values of fluorescence intensity. The values of fluorescence intensity and the standard error of each analysis were used to plot the graph. Data are expressed as mean ± standard error (represented using error bars).
*p ≤ 0.05.
CFW: Calcofluor white; MMcM: McVeigh/Morton’ liquid medium.
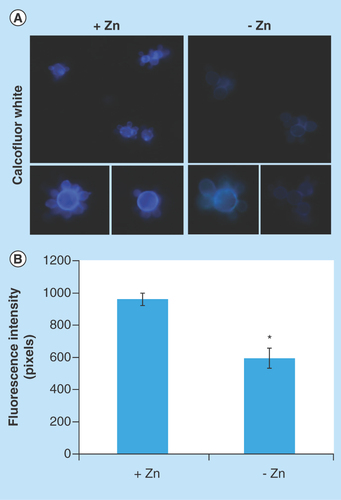
Figure 4. Zinc deprivation alters proteins glycosylation.
(A) Protein extracts of membranes were fractionated by electrophoresis and stained with periodic acid Schiff. The same extracts were stained with silver. (B) Fluorescence microscopy of P. lutzii cells that were cultured in the presence or absence of zinc for 24 h and subsequently incubated with ConA conjugated to FITC (increase of 40 times). (C) Fluorescence intensity graph. The data for fluorescence intensity evaluation were obtained through the AxioVision Software (Carl Zeiss). The values of fluorescence intensity (in pixels) and the standard error of each analysis were used to plot the graph. Data are expressed as mean ± standard error (represented using error bars), (*) represents p ≤ 0.05.
ConA: Concanavalin A; FITC: Fluorescein isothiocyanate.
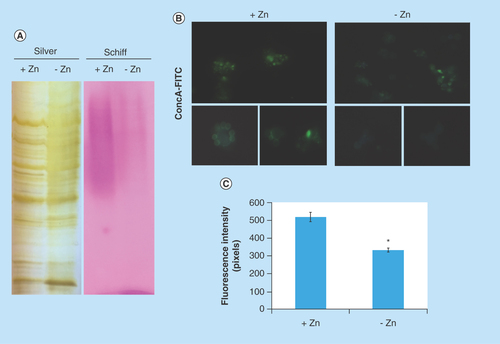
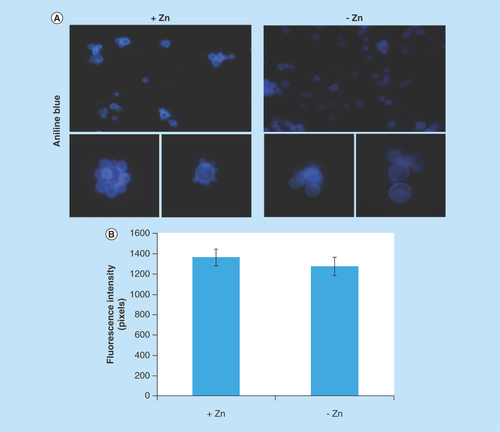
Figure 5. Evaluation of β-1,3 glucan quantities in the cell wall of Paracoccidioides lutzii.
(A) Aniline blue was used to evaluate, by fluorescence microscopy, the presence of β-1,3 glucan in the cell wall of P. lutzii after growth in the presence and absence of zinc (increase of 40 times). (B) Fluorescence intensity graph. The values of fluorescence intensity (in pixels) and the standard error of each analysis were used to plot the graph. Data are expressed as mean ± standard error (represented using error bars).