Figures & data
Figure 1. Schematic representation of multicore magnetic nanoparticles with their polymeric multifunctional coating.
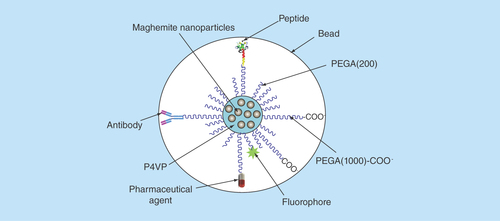
Figure 2. Bioferrofluids characterization.
(A) TEM images of maghemite MNPs in the bioferrofluid; (B) size distribution of spherical maghemite MNPs; (C) DLS size distribution of hydrodynamic size in the bioferrofluids sample.
DLS: Dynamic light scattering; MNPs: Magnetic nanoparticles; TEM: Transmission electron microscopy.
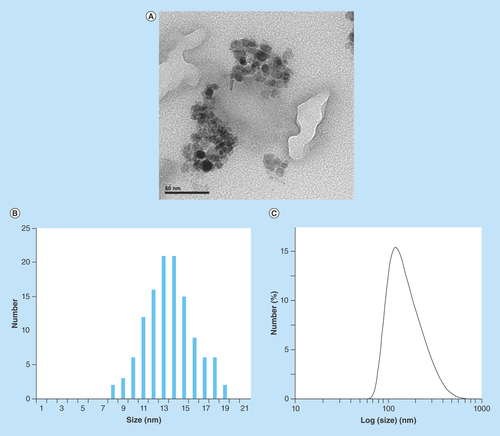
Figure 3. In vitro relaxation measurement.
Comparative analysis of the transverse relaxation rates (1/T2, s-1) (A) and longitudinal relaxation rates (1/T1, s-1) (B) of bioferrofluids and Endorem® as a function of iron concentration (mM). r2 and r1 were calculated from the slopes of each plot.
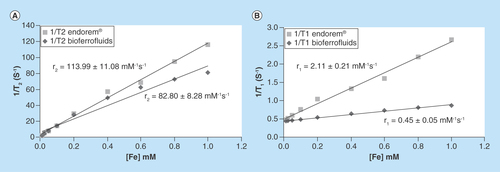
Figure 4. A dynamic first-passage bolus tracking curve for both Endorem® and bioferrofluids during an acquisition time of 60 s.
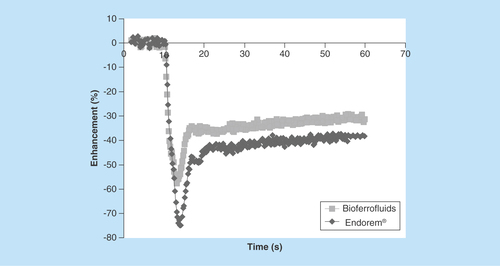
Figure 5. In vivo perfusion MRI.
T2*-weighted images for a mouse brain vasculature before (A, E), 5 min (B, F) and 2 h (C, G) after injection of Endorem® (upper panel) and bioferrofluids (lower panel). rCBV maps for Endorem and bioferrofluids are shown in (D) and (H), respectively.
rCBV: Regional cerebral blood volume
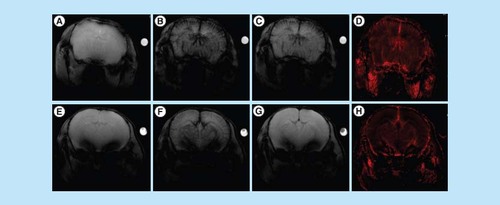
Figure 6. Liver MRI study.
Transverse relaxation time values (A) and signal intensity ratio values (B) of bioferrofluids and Endorem® in liver during 2 h after contrast agent injection. Data are presented as (mean ± SEM).
*Marks significant differences between Endorem and bioferrofluids, according to Mann–Whitney test, n = 10.
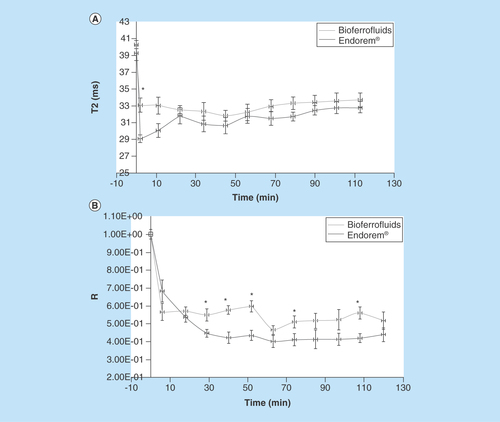
Figure 7. Transverse relaxation time values of bioferrofluids and Endorem® in liver during 60 days after contrast agent injection.
Data are presented as (mean ± SEM).
*Marks significant differences between Endorem and bioferrofluids, according to Mann–Whitney test, (until 15 days: n = 10; at 30 days: n = 8; and at 60 days: n = 4).
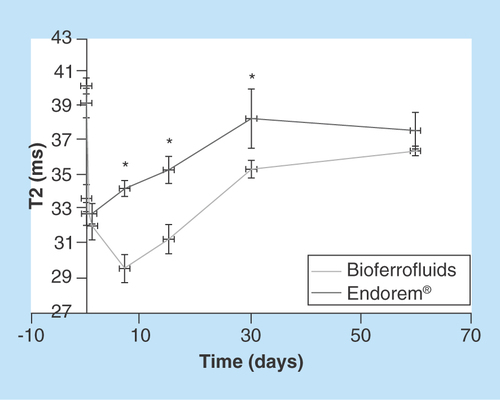
Figure 8. Qualitative iron detection.
Prussian blue assay in mouse liver of non-injected mouse (A) and after 2 h (B, C), 1 day (D, E), 7 days (F, G), 15 days (H, I), 30 days (J, K) and 60 days (L, M) of Endorem® (left panel) and bioferrofluids (right panel) injection. Black arrows are pointing ferric ions which appear as blue colored dots. Scale bar 50 μm.
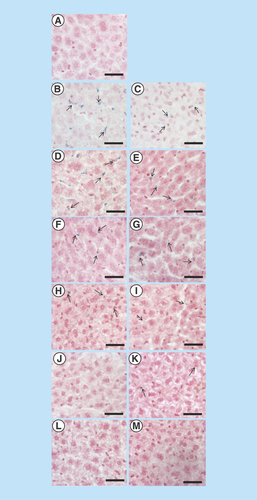
Table 1. A perspective idea about ferric ion concentration in liver of mice after contrast agent injection using Prussian blue assay.
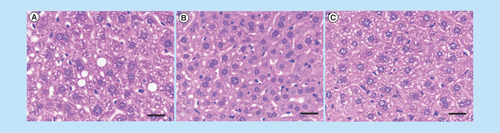
Figure 9. In vivo toxicity study.
Hematoxin and Eosin stain in liver of non-injected mouse (A) and after 7 days of bioferrofluids (B) and Endorem®(C) injection. Scale bar 25μm.