
Figures & data
Table 1. Plant parts used for capped gold nanoparticle synthesis and pathogenic bacteria with their origin.
Figure 1. Chemical reaction mechanism.
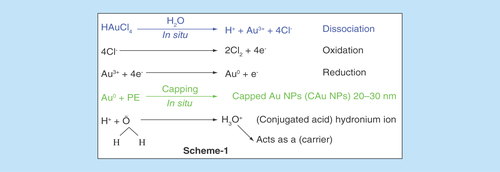
Figure 2. UV-Vis spectroscopy depicts maximum absorbance within 530–535 nm.
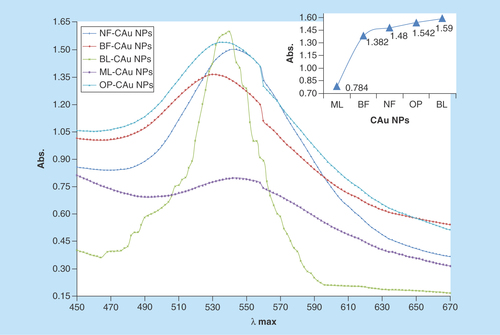
Figure 3. Stretching frequency at 700 cm-1 shows aromatic C–H bending, 1600 cm-1 aromatic C=C bending, 2100 cm-1 alkyl C=C stretching, 3300–3460 cm-1 alcohol/phenol O–H and 3600 cm-1 amide N-H.
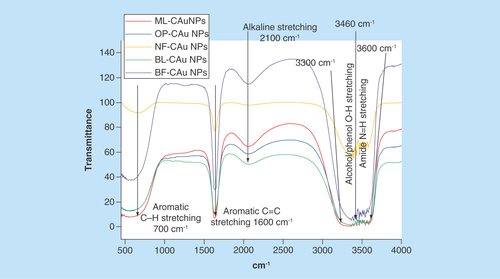
Figure 4. DLS micrograph of C-Au NPs. DLS images of C-AuNPs from PE (A) and (B) C-AuNPs with extracts BF and BL (C) NF C-AuNPs (D) ML C-AuNPs (E) OP C-AuNPs fruit respectively and (F) depicts PDI values of C-AuNPs.
BF: Basil flower; BL: Basil leaf; C-AUNP: Capped gold nanoparticle; DLS: Dynamic light scattering; ML: Mentha leaves; NF: Neem leaves; NP: Nanoparticle; OP: Orange peel; PE: Plant extract.
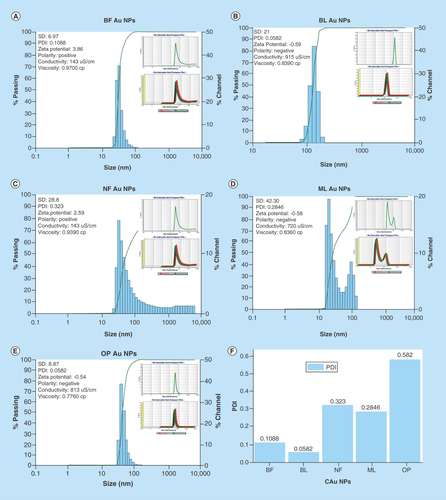
Figure 5. TEM image of C-AuNPs.
(A) and (B) C-AuNPs with extracts of flower and leaves of BF and BL (C) NF C-AuNPs (D) ML C-AuNPs (E) OP C-AuNPs fruit, respectively. Every graph has four images with different pixels and taken from 50, 20 and 5 nm with SAED pattern. C-AuNPs were analyzed with TEM and found <20 nm of size with 0.267 and 0.216 nm d spacing.
BF: Basil flowers; BL: Basil leaves; C-AuNP: Capped gold nanoparticle; ML: Mentha leaves; NF: Neem leaves; NP: Nanoparticle; OP: Orange peel; SAED: Selected area electron diffraction; TEM: Transmission electron microscopy.
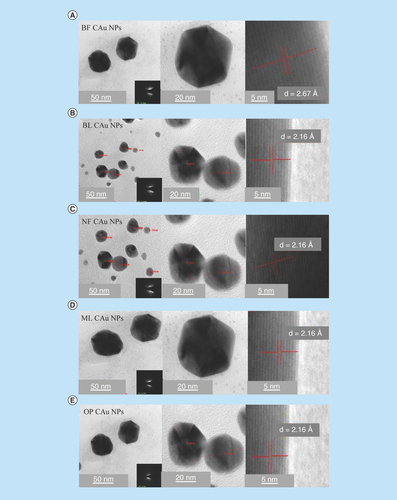
Figure 6. Nanoparticle size analyzed by TEM.
NP: Nanoparticle; TEM: Transmission electron microscopy.
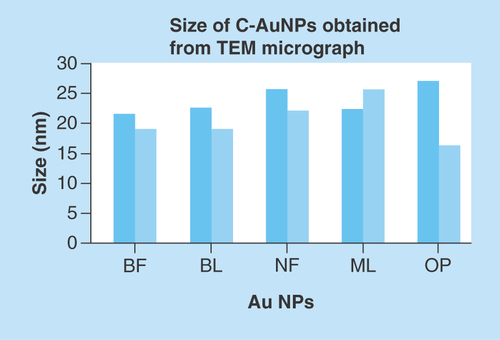
Figure 7. AFM topographical image.
AFM micrograph of C-AuNPs. (A–J) depicting shape, size, height, roughness and 3D topographical image due to natural properties of PEs. (A & B) and (C & D) graphical representation of morphology, size and 3D topographical image of C-AuNPs from extracts of flower and leaves of Ocimum tenuiflorum; (E & F) flower extract of Azadirachta indica; (G & H) leaves extract of Mentha spicata; and (I & J) peel extract of Citrus sinensis fruit, respectively. Every graph shows different size and morphology with a histogram of C-AuNPs.
C-AuNP: Capped gold nanoparticle; PE: Plant extract.
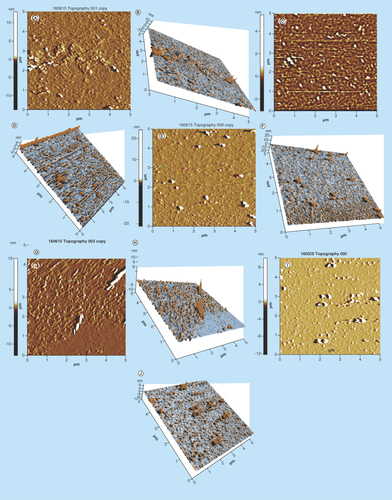
Figure 8. Size of gold nanoparticles capped with BF, BL, NF, ML and OP analyzed by AFM.
This figure depicts an effective C-AuNPs distribution with almost nil coagulation.
AFM: Atomic force microscopy; AuNP: Gold nanoparticle; BF: Basil flowers; BL: Basil leaves; ML: Mentha leaves; NF: Neem flowers; OP: Orange peel.
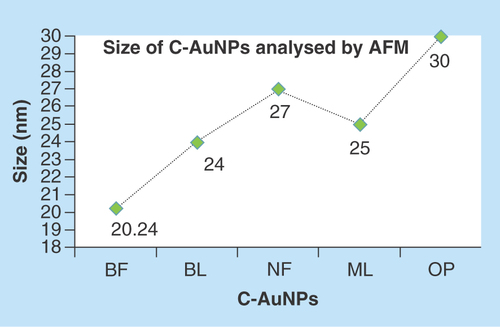
Figure 9. Antibacterial activities of MIC values of gold nanoparticles capped with BF, BL, NF, ML and OP for Gram-positive and Gram-negative bacteria inhibit the Staphylococcus aureus, Pseudomonas aeruginosa and Klebsiella pneumoniae.
BF: Basil flowers; BL: Basil leaves; ML: Mentha leaves; NF: Neem leaves; NP: Nanoparticle OP: Orange peel.
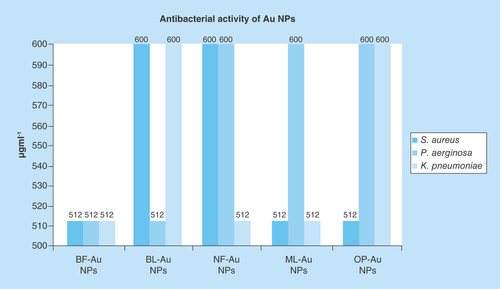
Table 2. Gram-positive and Gram-negative pathogenic bacteria used for antibacterial study.