Figures & data
Table 1. Comparison of quarters from 2010 to 2014 where damped trend forecasting outperformed linear regression.
Figure 1. Damped trend analysis for 2010.
(A) Damped trend and linear regression forecasts into the first 24 weeks without observed data for the time period. (B) The same comparisons as A with overlaying of observed values. (C) Damped trend and linear regression forecasts into the next 48 weeks of data. Each observation is the aggregation of a week-long period.
MAPE: Mean absolute percent error; Q: Quarter.
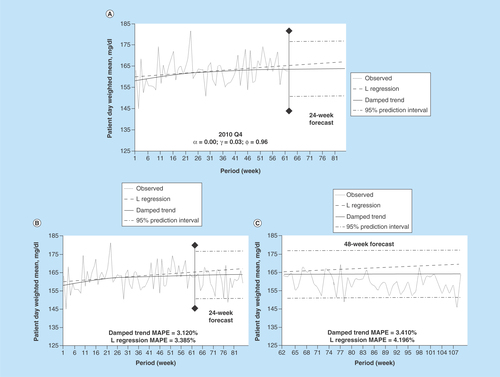
Figure 2. Damped trend analysis for 2011.
(A) Damped trend and linear regression forecasts into the first 24 weeks without observed data for the time period. (B) The same comparisons as A with overlaying of observed values. (C) Damped trend and linear regression forecasts into the next 48 weeks of data. Each observation is the aggregation of a week-long period.
MAPE: Mean absolute percent error; Q: Quarter.
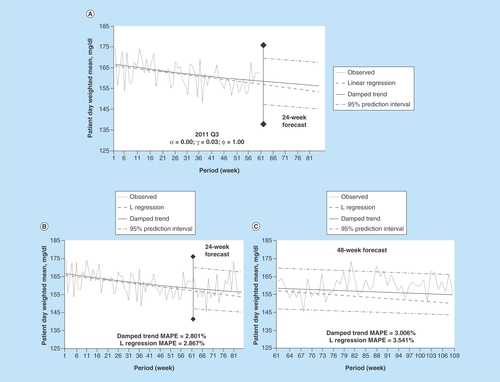
Figure 3. Damped trend analysis for 2012.
(A) Damped trend and linear regression forecasts into the first 24 weeks without observed data for the time period. (B) The same comparisons as A with overlaying of observed values. (C) Damped trend and linear regression forecasts into the next 48 weeks of data. Each observation is the aggregation of a week-long period.
MAPE: Mean absolute percent error; Q: Quarter.
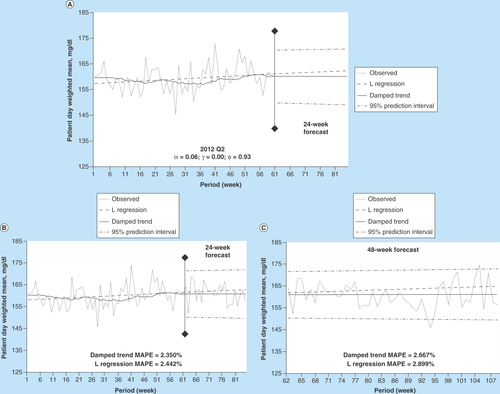
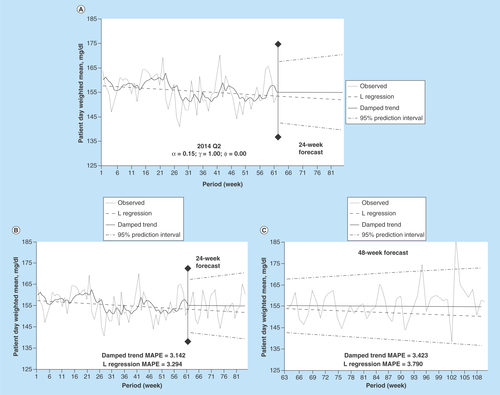
Figure 4. Damped trend analysis for 2014.
(A) Damped trend and linear regression forecasts into the first 24 weeks without observed data for the time period. (B) The same comparisons as A with overlaying of observed values. (C) Damped trend and linear regression forecasts into the next 48 weeks of data. Each observation is the aggregation of a week-long period.
MAPE: Mean absolute percent error; Q: Quarter.