Figures & data
Figure 1. Isolation of human oral mucosa middle interstitial tissue fibroblasts and analysis of differentiation.
(A) Phase-contrast micrographs showing temporal changes in clonal human oral mucosa middle interstitial tissue fibroblast growth in 0.8% methylcellulose culture for 2 weeks. Scale bar: 20 μm. (B) Hematoxylin and eosin staining on day 14 of (A). Scale bar: 20 μm. (C & D) Flow cytometry analysis of expression of CD56 (C) and PDGFRα (D). White histogram: isotype control; gray histogram: marker expression. Cell counts (number of cells) and fluorescence intensity are indicated on the ordinate and abscissa, respectively. (E) Association between differentiation and the expression of CD56 and PDGFRα. Ratios of CD56- and PDGFRα-positive cells are indicated on the ordinate and abscissa, respectively. Dots indicate each clone with (circles) or without (crosses) of one or more differentiated lineages. (F & G) Ratio of CD56- (F) or PDGFRα- (G) positive cells with (Dif+) or without (Dif-) differentiated lineage. Ratio of positive cells is indicated on the ordinate. Error bars and asterisks indicate SD (Dif+, n = 7; Dif-, n = 9) and p-values (CD56, p = 0.048; PDGFRα, p = 0.005), respectively.
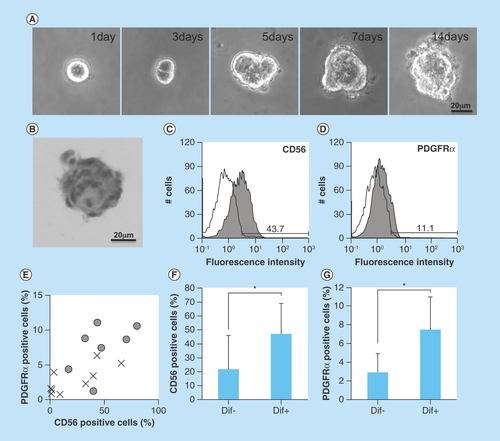
Table 1. Antibodies for flow cytometric analysis.
Table 2. Antibodies for immunostaining and Western blot.
Table 3. Primer sequences and product size of reverse transcription polymerase chain reaction.
Figure 2. Induction of differentiation into mesenchymal cells.
(A) ALP staining, (B) ARS staining, (C) oil red O staining, (D) safranin O staining and (E) immunohistochemistry of Coll II in noninduced (upper panel) and induced (lower panel) human oral mucosa middle interstitial tissue fibroblasts. Scale bars: 50 μm. Reverse transcription-PCR analysis shows (F) osteogenic (ALP, OPN), (G) adipogenic (PPAR-γ, leptin) and (H) chondrogenic (BMP-6, aggrecan)-specific gene expression. Primers used are listed in . GAPDH was used as an internal control. Left lane: noninduced human oral mucosa middle interstitial tissue fibroblasts; right lane: induced human oral mucosa middle interstitial tissue fibroblasts.
ALP: Alkaline phosphatase; ARS: Alizarin red S; Aggr: Aggrecan; Coll II: Collagen type II; GAPDH: Glyceraldehyde-3-phosphate dehydogenase; OPN: Osteopontin; PPAR-γ: Peroxisome proliferator-activated receptor-γ.
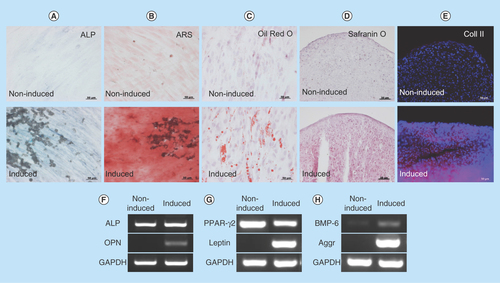
Figure 3. Expression of characteristic human oral mucosa middle interstitial tissue fibroblasts markers by flow cytometry.
Antibodies for flow cytometric analysis are listed in . White histogram: isotype control; gray histogram: marker expression indicated at the upper right of each panel. Cell counts (number of cells) and fluorescence intensity are indicated on the ordinate and abscissa, respectively. Numbers in panels indicate the positive rate.
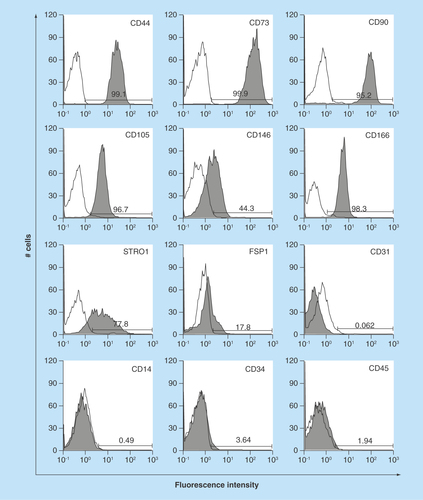
Figure 4. Expression of early neural crest (Twist1, Sox9, Snail1 and Snail2), ectomesenchymal (MSX2 and DLX6) and neural markers.
(A–I) Real-time PCR of early neural crest (Twist1, Sox9, Snail1, Snail2, CD56 and PDGFRα), ectomesenchymal (MSX2 and DLX6) and neural stem cell (nestin) markers. Y-axis indicates relative expression compared with the control group levels (hMSCs), which were normalized to 1. Error bars indicate SD (n = 4). (J) Phase-contrast images of noninduced (upper panel) and induced (lower) hOMFs. (K & L) Immunocytochemical staining of βIII-tubulin (K) and NFM (L). Noninduced (upper panel) and induced (lower) hOMFs. Nuclei were stained with 4′,6-Diamidino-2-phenylindole (DAPI). Scale bars: 50 μm.
hMSC: Human mesenchymal stem cell; hOMF: Human oral mucosa middle interstitial tissue fibroblast; NFM: Neurofilament medium.
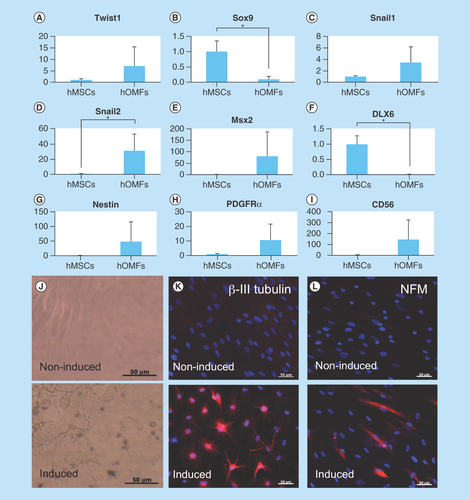
Figure 5. Differentiation of human oral mucosa middle interstitial tissue fibroblasts into cells with a keratocyte phenotype.
(A) Illustrated cultivation methods of hOMFs with hLE cells and hLS cells. (B) Comparison of keratocyte phenotype in each cell type by reverse transcription PCR. GAPDH was used as an internal control. (a) hOMFs alone. (b) hOMFs cocultured with hLE. (c) hOMFs cocultured with hLS. (d) hLS cocultured with hOMFs.
GAPDH: Glyceraldehyde-3-phosphate dehydogenase; hLE: Human limbal epithelial cell; hLS: Human limbal stromal cell; hOMF: Human oral mucosa middle interstitial tissue fibroblast.
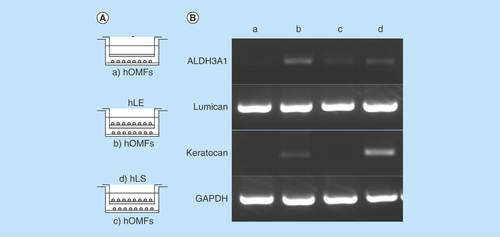
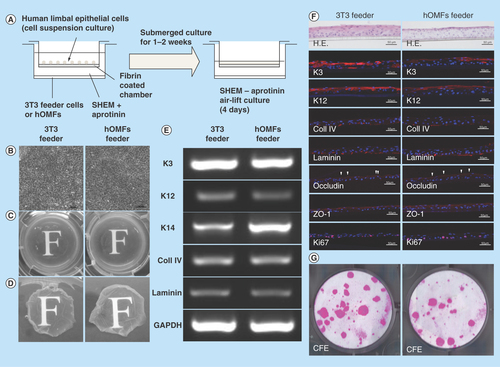
Figure 6. Cultivation of human limbal epithelial sheets with two types of feeder cells.
(A) Illustrated cultivation methods of human limbal epithelial sheets. (B) Phase-contrast micrographs of epithelial sheets with 3T3 (left panel) and hOMF (right panel) feeder cells. Scale bars: 50 μm. (C) Photographs of both types of human limbal epithelial sheets. (D) Macroscopic view of both types of human limbal epithelial sheets after removing culture inserts. (E) Comparison of both types of human limbal epithelial sheet phenotypes by reverse transcription polymerase chain reaction. GAPDH was used as an internal control. (F) Histochemical comparison of the phenotypes of both types of human limbal epithelial sheets. Arrowheads indicate occludin expression. Scale bars: 50 μm. (G) Comparison of CFE in each sheet. Colonies were stained with rhodamine B after 2 weeks.
CFE: Colony-forming efficiency; GAPDH: Glyceraldehyde-3-phosphate dehydogenase; H.E.: Hematoxylin & eosin; hOMF: Human oral mucosa middle interstitial tissue fibroblast; SHEM: Supplemental hormonal epithelial medium.