
Figures & data
Table 1. Some demographic and baseline data of three group of children.
Table 2. Urine and serum concentration of IL-32 and UIL-32/Cr in three groups of children.
Figure 1. The receiver operating characteristic curve of urine IL-32 to creatinine for distinguishing (A) group 1 (Area under curve and scar) vs group 3 (Controls); (B) group 2 (Area under curve without scar) vs group 3 and (C) groups 1 + 2 vs group 3.
ROC: Receiver operating characteristic.
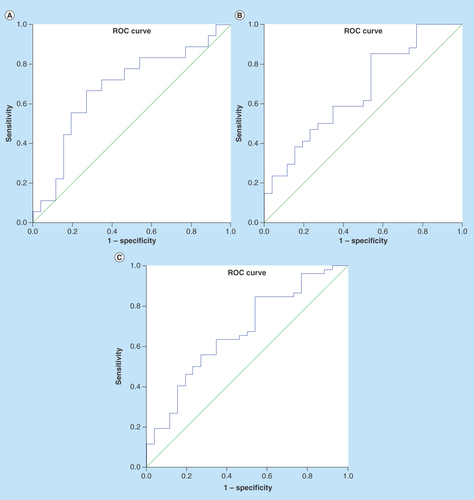
Table 3. Cut-off value of urinary IL-32 to creatinine ratio for comparison of three group of children.