Figures & data
Figure 1. Novel workflow for circulating tumor cell detection and characterization.
Human whole blood is hemolyzed and centrifuged to harvest nucleated cells. ClearCell® FX enriches CTCs based on size. Enrichment product is loaded onto microfluidic chips and stored at 4°C until ready for analysis. CTCs immobilized on microfluidic chips are phenotyped with monoclonal antibodies against tumor markers using the Zellkraftwerk CYTOBOT.
CTC: Circulating tumor cell.
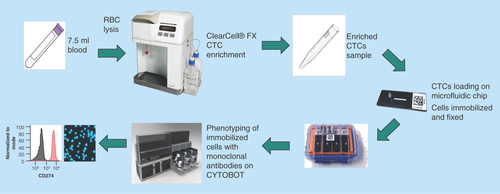
Figure 2. Establishment of PD-L1 and PD-L2 analysis by chipcytometry.
(A) Flow cytometry analysis. Non-small-cell lung cancer cell lines A549 and H1975 were incubated with antihuman PD-L1 and PD-L2 (black), and corresponding isotype control (gray). Cells were fixed prior to staining. (B & C) Chipcytometry analysis. A549 cells (black), H1975 cells (black) and whole blood samples collected from a healthy donor (gray) were loaded onto Zellkraftwerk ZellSafe™ chips, fixed and stained with antihuman PD-L1 and PD-L2.
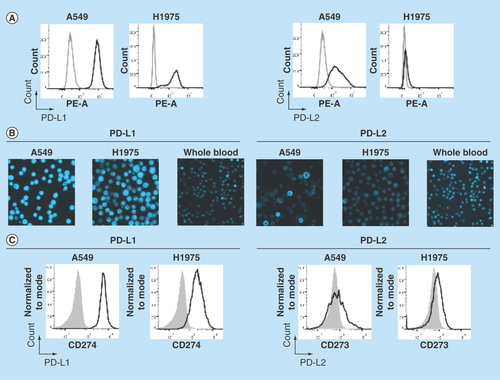
Figure 3. Microfluidic chipcytometric detection and characterization of spiked tumor cells.
CK, EpCAM, nuclear, CD45, PD-L1, PD-L2 and vimentin staining were used to distinguish tumor cells (population highlighted in red) from the white blood cell population after enrichment on the ClearCell FX® system. (A & C) Whole blood spiked with H1975 tumor cells. (B & D) Whole blood not spiked with H1975 tumor cells. (A & B) H1975 cells gated as CK+, EpCAM+, DAPI+ and CD45-. (C & D) Histograms of PD-L1, PD-L2 and vimentin expression in H1975 tumor cells (red) and white blood cell contaminants (black).
CK: Cytokeratin; EpCAM: Epithelial cell adhesion molecule.
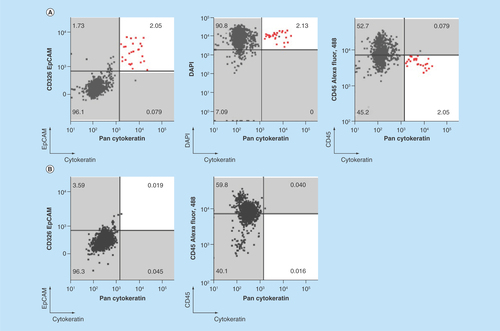
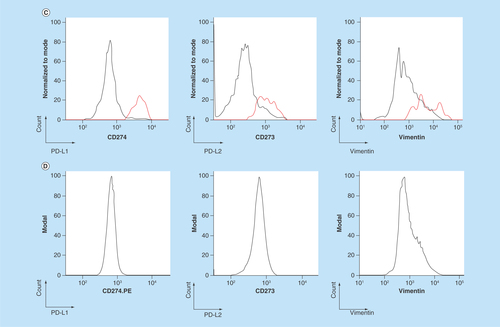
Figure 4. Representative images from the microfluidic chipcytometric detection and characterization of spiked tumor cells.
(A) H1975 cells detected in the spiked samples. The staining profile allows us to distinguish these cells from the white blood cells. (B) Representative images of white blood cell contaminants present after enrichment by ClearCell FX® system.
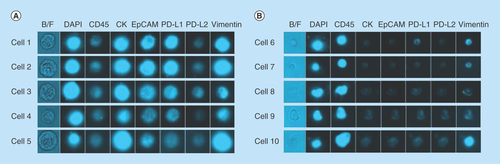
Table 1. Recovery of H1975 cells as identified by Zellkraftwerk chipcytometry after enrichment of spiked blood samples by ClearCell® FX system.
Table 2. Clinicopathological characteristics of metastatic breast cancer patients who provided samples for this study.
Figure 5. Example images of a circulating tumor cell isolated from a breast cancer patient.
Blood from the patient was processed for CTC enrichment using the ClearCell® FX system. The sample was then analyzed by chipcytometry and a single CTC determined to be PD-L1/PD-L2 negative was detected.
CTC: Circulating tumor cell.