Figures & data
Figure 1. Transmission electron micrographs and hydrodynamic particle size (nm) distribution by dynamic light scattering analysis of exosomes isolated by kit and ultracentrifugation from glioblastoma multiforme and breast cancer cells.
Images were taken with a magnification of 400,000 and the dashed areas were additionally zoomed. (A) Micrographs of GBM exosome isolates (not CD9-labeled). (a) depicts the micrograph from a kit isolate; (b) the kit blank; (c) a UC isolate; and (d) the UC blank. (B) DLS analysis of GBM exosomes isolated by kit and UC. No particles were detected in the UC blank. The DLS analysis of the kit blank was not performed. C) Micrographs of BC exosome isolates (successfully CD9-labeled). (a) depicts the micrograph from a kit isolate; (b) the kit blank; (c) a UC isolate; and (d) the UC blank. (D) DLS analysis of BC exosomes isolated by kit and UC, including the kit blank. No particles were detected in the UC blank.
BC: Breast cancer; DLS: Dynamic light scattering; GBM: Glioblastoma multiforme; UC: Ultracentrifugation.
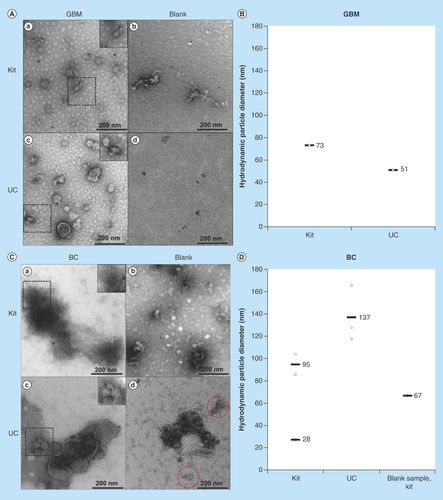
Figure 2. Western blotting of common protein exosome markers.
The protein markers CD81, CD9, CD63, TSG101, FLOT1 (positive markers, +) and CNX (negative marker, -) were targeted in cell lysates, and exosomes isolated by kit and UC (n ≥ 2). Monoclonal mouse antibodies were used for CD81, CD9, CD63, FLOT1 and CNX, while a polyclonal rabbit antibody was used for TSG101. For the BC exosomes, 15 μg protein was loaded for kit isolates and 3 μg for UC isolates. For the GBM exosomes, approximately 14 μg was loaded for kit isolates and approximately 8 μg for UC isolates. Uncropped western blots are presented in Supplementary western blots.
BC: Breast cancer; CNX: Calnexin; FLOT1: Flotillin-1; GBM: Glioblastoma multiforme; UC: Ultracentrifugation.
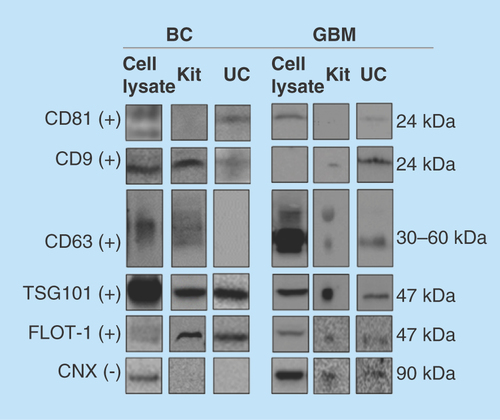
Figure 3. Chromatograms and MS/MS spectrums from nanoLC–MS analysis of in-gel digested glioblastoma multiforme and breast cancer exosome peptides using data-dependent acquisition.
(A) Chromatogram with corresponding MS/MS spectrum for the CD9 signature peptide KDVLETFTVK (m/z = 393.89, z = 3) in BC exosomes isolated by UC. (B) Chromatogram with corresponding MS/MS spectrum for the CNX signature peptide AEEDEILNR (m/z = 544.77, z = 2) from GBM exosomes isolated by UC. An in-house packed 50 μm × 150 mm column with 80 Å Accucore particles with C18 stationary phase was used for separation. The elution was performed with a linear gradient of 3–15% MP B in 120 min.
BC: Breast cancer; GBM: Glioblastoma multiforme; UC: Ultracentrifugation.
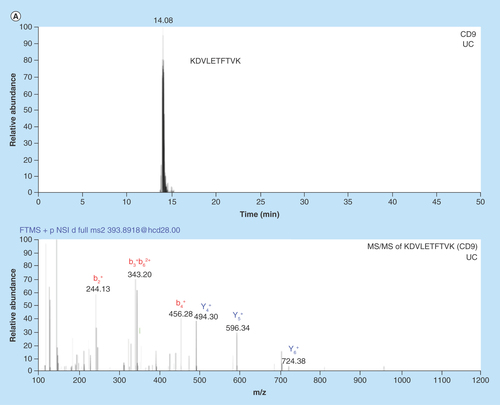
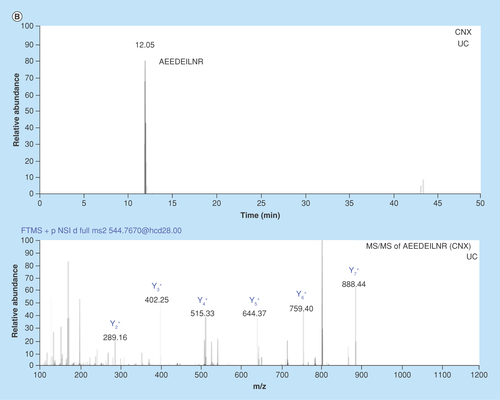
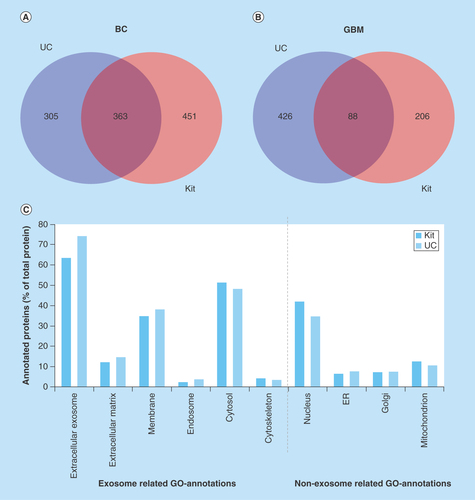
Figure 4. Venn diagram comparing the number of proteins identified by nanoLC–MS/MS in glioblastoma multiforme and breast cancer exosome samples and gene ontology annotation of proteins in breast cancer exosomes.
(A) Venn diagram of proteins identified in BC exosome samples with UC (from 2697 identified peptides) and kit (from 3795 peptides identified) (n = 3). (B) Venn diagram of proteins identified in GBM exosome samples with UC (from 1840 identified peptides) and kit (from 1035 identified peptides; n = 6). (C) GO annotation of proteins in BC exosomes. The identified proteins were classified by their cellular location (GO annotations) and then grouped based on their positive/negative relevance toward exosomes. The annotated proteins (% of total proteins) and their cellular location from kit isolates (red, from 749 DAVID ID’s) and UC isolates (blue, from 615 DAVID IDs).
BC: Breast cancer; GBM: Glioblastoma multiforme; GO: Gene ontology; UC: Ultracentrifugation.