Figures & data
Figure 1. Mouse lymph node: correctly prepared.
Green outlines indicate the borders of actual tissue sections relative to their position on the slide. Blue boxes show the area that was actually imaged.
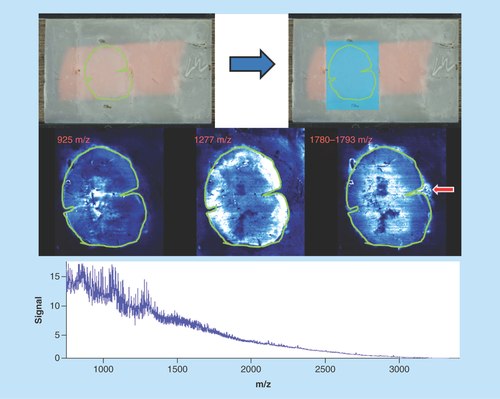
Figure 2. Human spinal cord.
Green outlines indicate the borders of actual tissue sections relative to their position on the slide. Blue boxes show the area that was actually imaged.
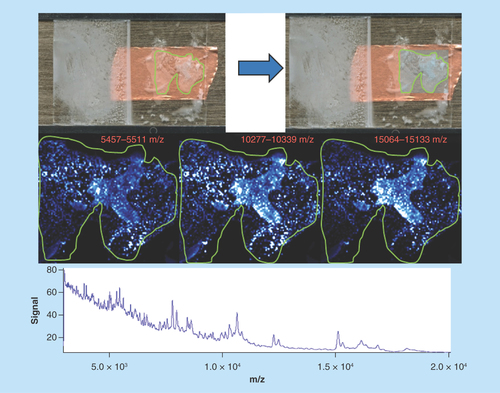
Figure 3. Lamb liver.
Green outlines indicate the borders of actual tissue sections relative to their position on the slide. Blue boxes show the area that was actually imaged.
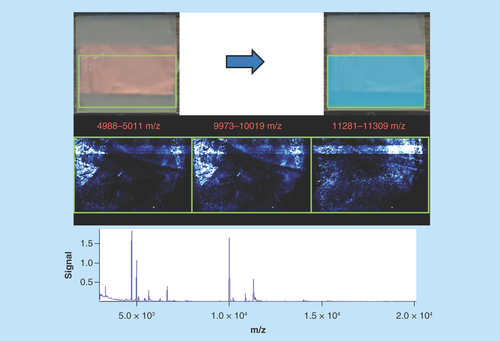
Figure 4. PK15 cell line monolayer.
Green outlines indicate the borders of actual tissue sections relative to their position on the slide. Blue boxes show the area that was actually imaged.
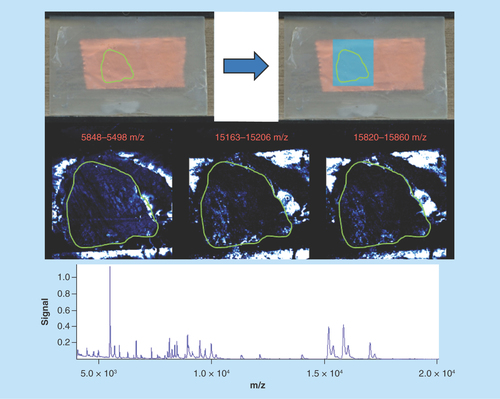
Figure 5. Mouse heart 1.
Green outlines indicate the borders of actual tissue sections relative to their position on the slide. Blue boxes show the area that was actually imaged.
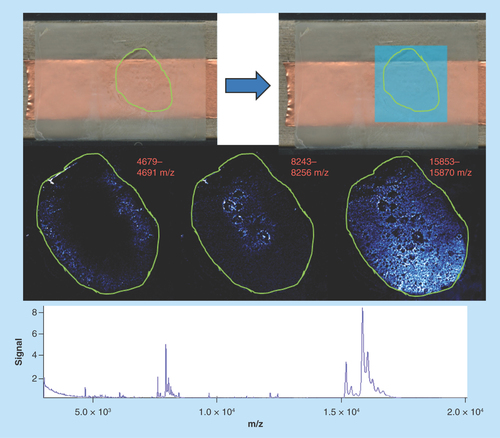
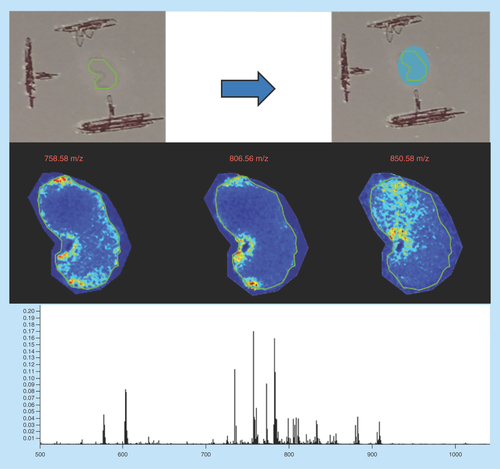
Figure 6. Mouse kidney.
Green outlines indicate the borders of actual tissue sections relative to their position on the slide. Blue boxes show the area that was actually imaged.
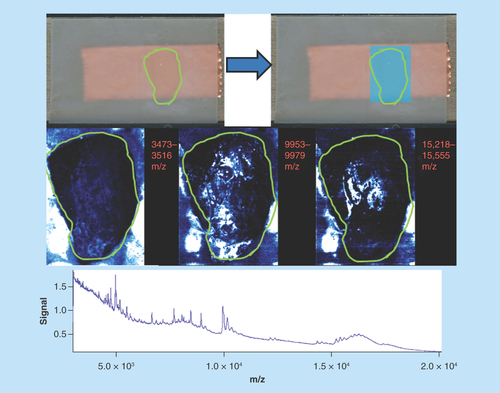
Figure 7. Mouse liver 1.
Green outlines indicate the borders of actual tissue sections relative to their position on the slide. Blue boxes show the area that was actually imaged.
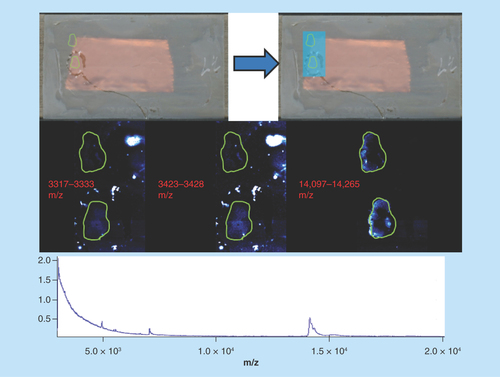
Figure 8. Mouse spinal cord.
Green outlines indicate the borders of actual tissue sections relative to their position on the slide. Blue boxes show the area that was actually imaged.
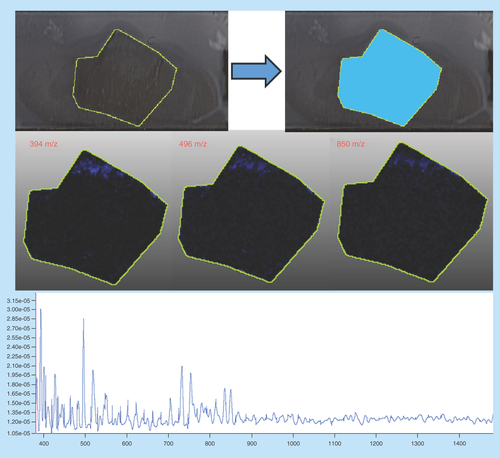
Figure 9. Human brain.
Green outlines indicate the borders of actual tissue sections relative to their position on the slide. Blue boxes show the area that was actually imaged.