Figures & data
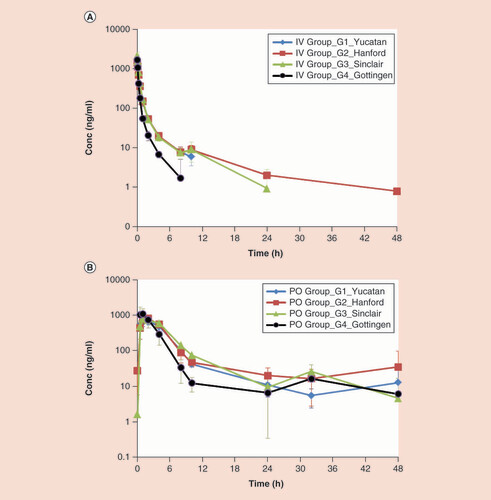
Data shown following a 0.5 mg/kg intravenous dose (A) or 5 mg/kg oral dose (B) administration to fasted Yucatan (blue diamond), Hanford (red square), Sinclair (green triangle) or Göttingen (black circle) minipig.

Intravenous Clp (A) or oral AUC0–48h(B) in various strains of minipig.
aClp in Göttingen compared with other strains, p < 0.0001, Dunnett’s test.
(A) Comparison of mean plasma clearance of (+)-(R)-VER and (−)-(S)-VER across four strains of minipig after intravenous administration of R,S-VER at 0.2 mg/kg. aSinclair compared with other strains, p < 0.05, Dunnett’s test, n = 4. (B) Comparison of mean AUC0–48h ratio of (+)-(R)-NOR or (−)-(S)-NOR to their respective parent enantiomers after oral administration of R,S-VER at 2 mg/kg in various minipig strains.