Figures & data
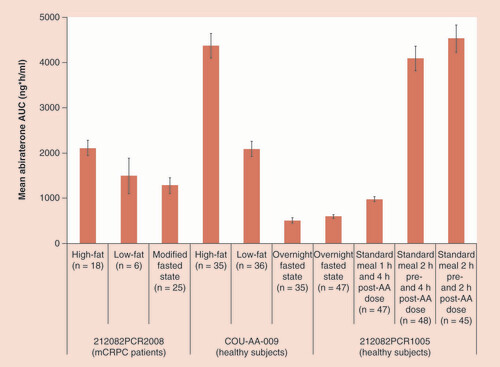
Table 1. Overview of clinical studies evaluating food effect on abiraterone pharmacokinetics.
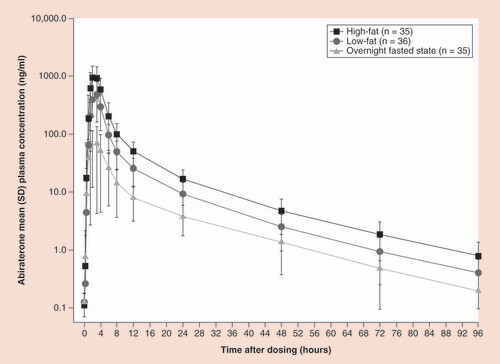
Mean (standard deviation) abiraterone plasma concentration–time curves (log-linear scale) following a single 1000-mg dose of abiraterone acetate in a fasted state, with a low-fat meal, or with a high-fat meal in healthy subjects.
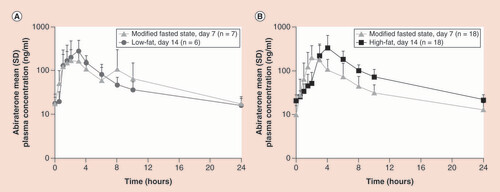
Effect of food timing on the mean (standard deviation) plasma concentration–time profiles of abiraterone.
Adapted with permission from [Citation18] © Springer (2015).
![Figure 2. Food timing impacts abiraterone exposure. Effect of food timing on the mean (standard deviation) plasma concentration–time profiles of abiraterone.Adapted with permission from [Citation18] © Springer (2015).](/cms/asset/6d62c0d6-77ea-4796-9bbd-139a45c92b6c/iipk_a_12364612_f0002.jpg)
(A) Arithmetic mean (standard deviation) abiraterone plasma concentration–time profile (log-linear scale) under Day 7 modified fasted conditions or Day 14 low-fat meal. (B) Arithmetic mean (standard deviation) abiraterone plasma concentration–time profile (log-linear scale) under Day 7 modified fasted conditions or Day 14 high-fat meal.
The values are reported as the arithmetic mean ± standard error of the mean. A standard meal was given 4 h post-AA dose in all studies.