Figures & data
Table 1. In silico simulation design for the evaluation of the impact of CYP3A4 inhibition on the pharmacokinetics of LY2623091 using Simcyp.
Table 2. Drug-specific assumption of parameters of LY2623091 used to construct the physiologically based pharmacokinetic model.
Table 3. Observed and predicted pharmacokinetic parameters for LY2623091, itraconazole, and hydroxy-itraconazole and observed and predicted interaction ratios for LY2623091 in the presence of itraconazole and diltiazem.
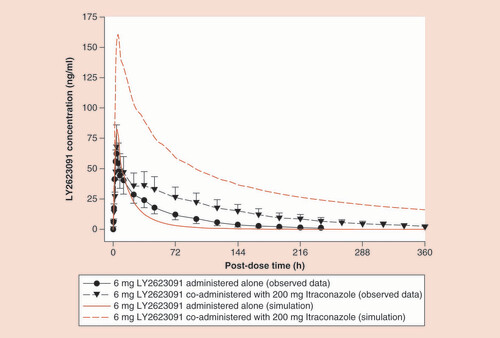
Red lines represent simulations; black lines show the observed data with the error bars representing the 90% confidence interval.
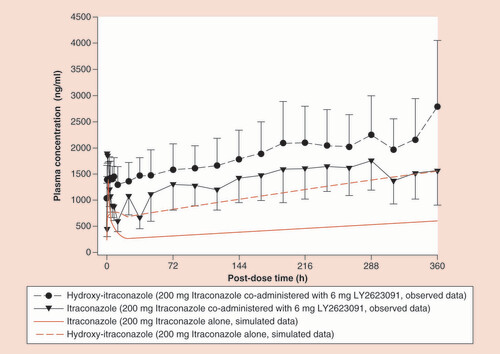
Red lines represent simulations; black lines represent observed data with the error bars representing the 90% confidence interval.
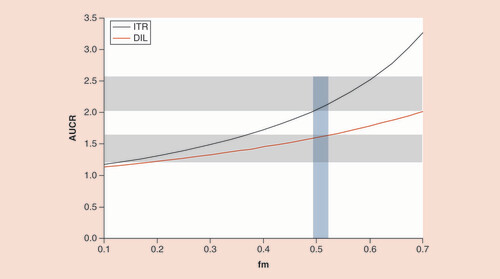
AUCR: Area under the concentration–time curve ratio; DIL: Diltiazem; fm: Fraction metabolized; ITR: Itraconazole.
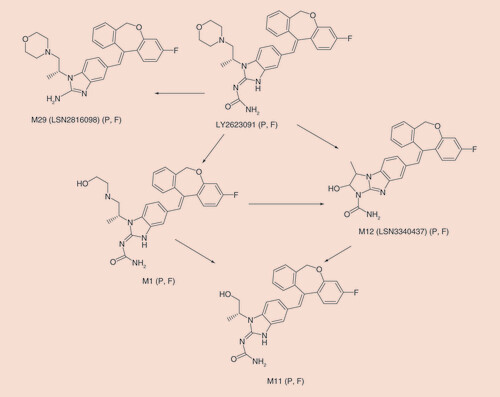
F: Feces; P: Plasma.