Figures & data
Table 1. Extracted clinical data of children exposed to ketamine.
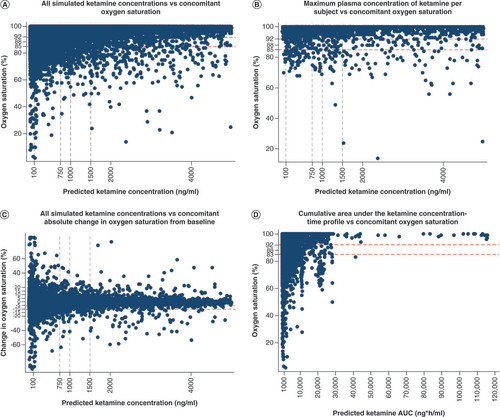
Relationship between simulated plasma ketamine exposure and oxygen saturation according to: (A) all simulated ketamine concentrations versus concomitant oxygen saturation; (B) maximum plasma concentration of ketamine per subject versus concomitant oxygen saturation; (C) all simulated ketamine concentrations versus concomitant absolute change in oxygen saturation from baseline; and (D) cumulative area under the ketamine concentration-time profile versus concomitant oxygen saturation. Oxygen saturation cutoff values of 92, 88 and 85% are depicted with horizontal red dashed lines. Ketamine plasma concentrations cutoffs previously associated with efficacy are shown with horizontal grey dashed lines.
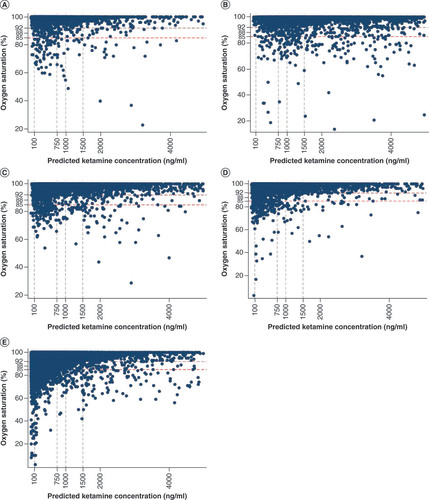
Relationship between simulated ketamine exposure and systemic oxygen saturations by postnatal age according to: (A) ≤1 month of age; (B) >1 month to 2 years of age; (C) >2 years to 6 years of age; (D) >6 years to 12 years of age; and (E) >12 years of age. Oxygen saturation cutoff values of 92, 88 and 85% are depicted with horizontal red dashed lines. Ketamine plasma concentrations cutoffs previously associated with efficacy are shown with vertical grey dashed lines.
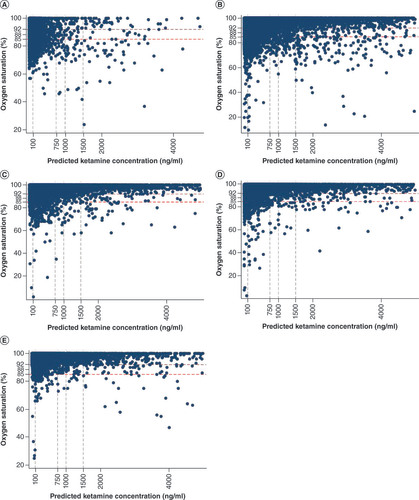
Relationship between simulated ketamine exposure and systemic oxygen saturations stratified by time after first dose according to: (A) ≤5 min after first dose; (B) >5–15 min after first dose; (C) >15–30 min after first dose; (D) >30–60 min after first dose; and (E) >60 min after first dose. Oxygen saturation cutoff values of 92, 88 and 85% are depicted with horizontal red dashed lines. Ketamine plasma concentrations cutoffs previously associated with efficacy are shown with vertical grey dashed lines.