Figures & data
Figure 1. Dose responsive curve for endothelial cell proliferation and migration with DHA treatment. (A) MTT assay for HUVECs treated with DHA at different concentrations for 12 hrs and 24 hrs. n = 6; *, P < 0.05; **, P < 0.01; (B) Transwell migration assay for HUVECs treated with DHA at different concentrations for 12 hrs. n = 4; *, P < 0.05; **, P < 0.01. (C) Representative images of transwell migration assay treated with 0 and 25 μM DHA.
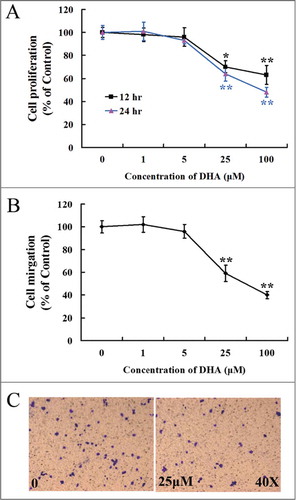
Figure 2. The effects of DHA onVEGFR1 and VEGFR2 expression in endothelial cells. (A) Relative VEGFR1 mRNA expression in HUVECs treated with DHA by RT-PCR. n.s., non-significant; (B) Relative VEGFR2 mRNA expression in HUVECs treated with DHA by RT-PCR. n = 4; **, P < 0.01; (C) Representative immunoblot of VEGFR1 in DHA treated HUVECs; (D) Representative immunoblot of VEGFR2 in DHA treated HUVECs.
Figure 3. DHA inhibits NF-κB pathway in endothelial cells. (A) Representative immunoblots of IκB-α (cytoplasmic) and NF-κB p65 (nuclear) extracted from HUVECs treated with DHA for 6 hrs. GAPDH and Histone H3 were used as loading control for cytoplasmic and nuclear protein, respectively. (B) Immunoflourescence staining of NF-κB p65 in HUVECs. Arrows refer to positive p65 staining in the nucleus.
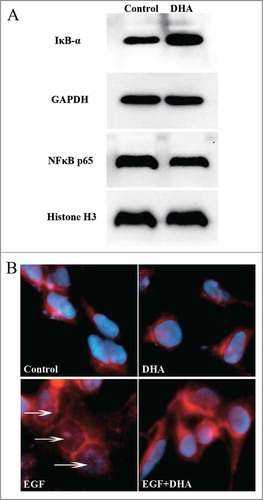
Figure 4. DHA regulates VEGFR2 promoter activity via NF-κB binding motif. (A) Comparison of the activity of VEGFR2 promoter with and without the mutation of NF-κB binding site. n = 6, ** P < 0.01; (B) The effects of DHA on VEGFR2 promoter activity. n = 6, * P < 0.05; (C) The effects of DHA on the activity of VEGFR2 promoter with the mutation of NF-κB binding site. n = 6. (D) ChIP assay for p65 binding to VEGFR2 promoter in HUVEC with and without DHA treatment. (E) Binding ratio relative to total input chromatin in the ChIP reaction.
Figure 5. The effects of PDTC on VEGFR2 expression in endothelial cells treated with DHA. (A) Relative VEGFR2 mRNA expression in HUVECs treated with PDTC. n = 4; *, P < 0.05; **, P < 0.01; (B) Relative VEGFR2 mRNA expression in HUVECs treated with DHA after PDTC pretreatment. n = 4; n.s., non-significant. (C) Representative immunoblot of VEGFR2 in DHA treated HUVECs after PDTC pre-treatment.
Figure 6. The effects of PDTC on DHA induced repression of angiogenesis. (A) MTT assay for HUVECs treated with PDTC and DHA for 12 hrs. n = 6; *, P < 0.05; **, P < 0.01; (B) ECIS proliferation assay. The data are shown relative to control cells and the bar graphs represent the average of 3 repeats at the indicated time points. (C) Transwell migration assay for HUVECs treated with PDTC and DHA for 12 hrs. n = 4; **, P < 0.01; n.s., non-significant; (D) ECIS wound healing assay. The data are shown relative to control cells and the bar graphs represent the average of 3 repeats at the indicated time points. (E and F) Angiographic analysis of the effect of PDTC and DHA on retinal neovascularization. (E) Representative image of FITC-isolectin staining of PI7 retinal blood vessels from eyes of hypoxic mice with PBS,DHA,PDTC and PDTC plus DHA; (F) Relative retinal vessel density of the hypoxic mice treated with DHA with and without PDTC co-treatment. n = 6; **, P < 0.01; n.s., non-significant.
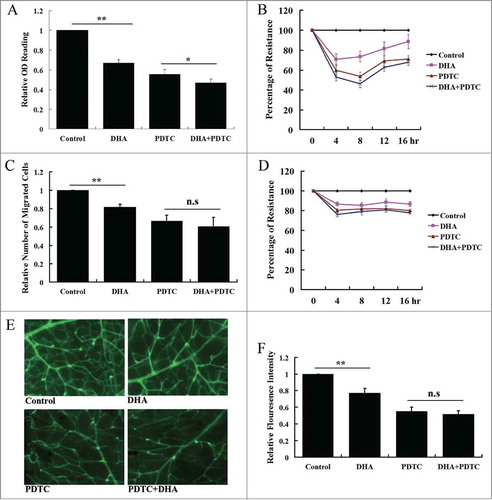
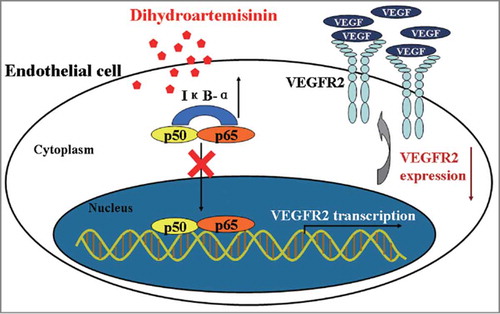
Figure 7. Schematic illustration of the mechanisms of the anti-angiogenesis effects of DHA.