Figures & data
Figure 1. Muscarinic receptor expression in bladder cancer biopsies. (A) M1, M2 and M3 mRNA expression levels in normal bladder and in low and high TCC grade. mRNA levels for M1 and M3 receptor subtype were significantly upregulated only in low-grade tumor tissues compared to controls, differently from mRNA levels for M2 subtype receptor whose expression in the high-grade tumors was statistically significant increased than both in normal tissue and low-grade tumors (B) Immunohistochemistry analysis for M2 receptor expression. M2 expression in normal, low, and high TCC grade (40×). The graph shows the quantification of the percentage of the M2 positive cells in high and low TCC grade. (C) Immunohistochemistry analysis showing the M2 receptor expression in the normal and transitional area nearby the tumoral region. Magnification 20×. *P < 0.05, **P < 0.01, #P < 0.001.
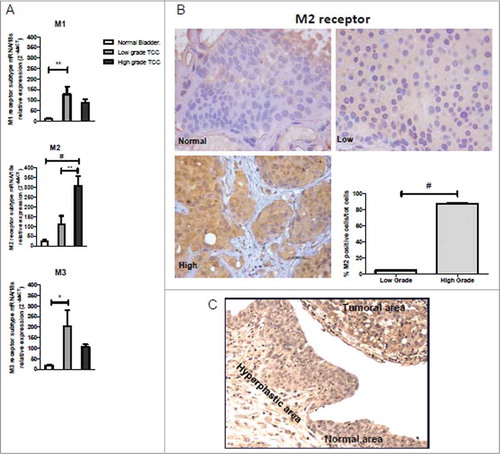
Figure 2. The M2 agonist Arecaidine inhibits in vitro cell proliferation of T24. (A) M1, M2 and M3 mRNA expression levels in T24 cell line. (B) MTS assay of T24 cell viability in absence (control) or in presence of (12.5, 25, 50, 100 μM) for 24 and 48 hrs. Cell survival was significantly decreased after both 24 and 48 hrs of treatment with 100 μM in presence of Arecaidine as well as at 48 hrs at lower concentrations. #P < 0.001. Ctl, control. O.D., optical density.
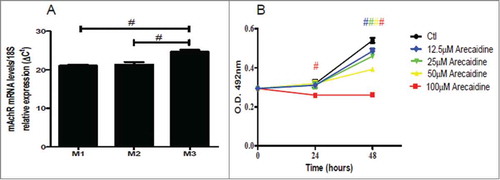
Figure 3. Effect of M2-silencing on T24 cell growth. (A) T24 transfected with Chromo GAPDH siRNA for 48 hrs (red) used as control of transfection (bar = 50 μm). (B) Western blot of the GAPDH expression in T24 cells in absence (CTRL) and in presence of Chromo-GAPDH siRNA (after 48 hrs of transfection). Actin and GAPDH were used to normalize the bands. (C) Representative image of Western blot of M2 receptor expression in T24 cells in absence and in presence of M2-siRNA pool (after 48 hrs of transfection). U251 cells were used as positive control of M2 receptor expression (see Ref Citation28) and actin to normalize the bands. (D) MTS analysis performed in T24 cell lines after 48 hrs of siRNA transfection and additional 48 hrs of Arecaidine (100 μM) treatment. The values are the mean ± SEM of 2 independent experiments performed in triplicate. ***P < 0.001. CTRL, control; O.D., optical density.
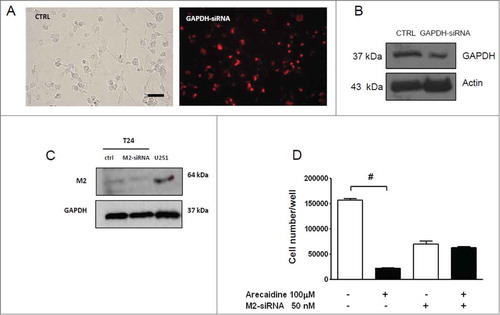
Figure 4. MTS analysis in absence or in presence of Arecaidine alone or in combination with M1 (pirenzepine) and M3 antagonist (4-DAMP). In particular, the M3 antagonist further enhances the decrease in T24 cell viability/proliferation mediated by Arecaidine. #P < 0.001. Ctl, control, Are, Arecaidine, Pir, Pirenzepine, O.D., optical density.
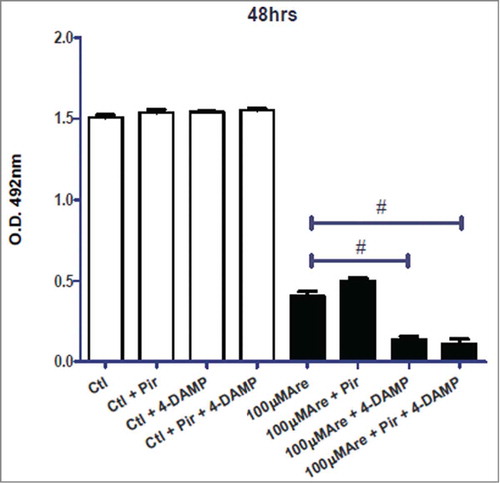
Figure 5. Immunofluorescence and cell viability of human dermal fibroblasts. (A) Human dermal fibroblasts expressing the M2 muscarinic receptor. Blue, DAPI; Red, M2 receptor. (B) Human dermal fibroblast cell viability/proliferation in presence of different concentrations of Arecaidine. Gallamine (10−6M) was used as M2 antagonist to counteract the Arecaidine effects. Ctl, control, Are, Arecaidine, Gal, Gallamine, O.D., optical density.
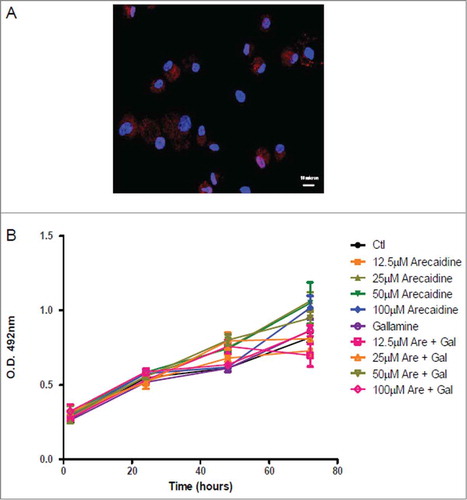
Figure 6. The M2 agonist Arecaidine inhibits in vitro cell proliferation of 5637 cell line. (A) M1, M2 and M3 mRNA expression levels in 5637 cell line. (B) MTS assay of 5637 cell proliferation in absence (control) or in presence of Arecaidine (12.5, 25, 50, 100 μM) for 24 and 48 hrs where cell survival was significantly decreased in a dose-dependent manner after both 24 and 48 hrs of treatment with Arecaidine. (C) Representative images of Western blot of M2 receptor expression in 5637 cells in absence and in presence of M2-siRNA pool (after 48 hrs of transfection). GAPDH was used to normalize the bands. (D) MTS analysis (reported as N. of cells) performed in 5637 cell line after 48 hrs of siRNA transfection and additional 48 hrs of Arecaidine (100 μM) treatment. The values are the mean ± SEM of 2 independent experiments performed in triplicate. #P < 0.001. Ctl, control. O.D., optical density.
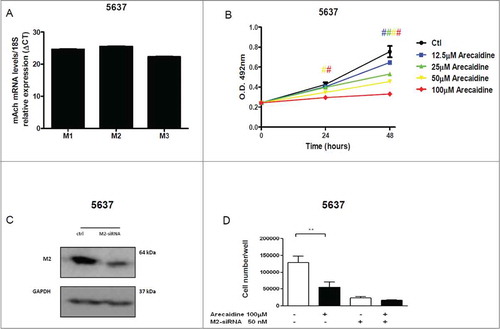
Figure 7. The M2 agonist Arecaidine inhibits in vitro cell migration of T24 cell line. Representative microscopic fields of T24 cell migration across an 8 μm pore size filter in absence (A) and in presence of 12.5 μM, (B) 25 μM, (C) 50 μM (D) and 100 μM (E) Arecaidine for 21 hours. Magnification 25×. (F) The graph shows that 12.5, 25 and 50 μM of Arecaidine were able to significantly decrease the number of migrated cells (10, 51 and 87%, respectively) with a better effect at 100 μM of Arecaidine. The bars represent the mean ± SD. *P < 0.05, **P < 0.001 vs. untreated cells. CTR, control, ARE, Arecaidine.
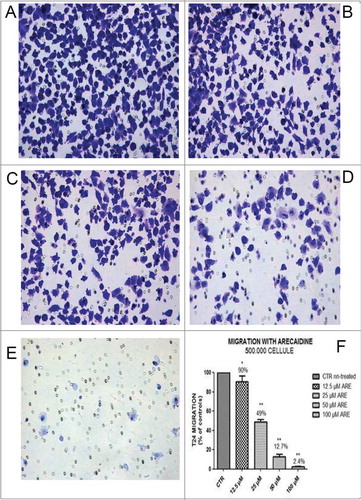
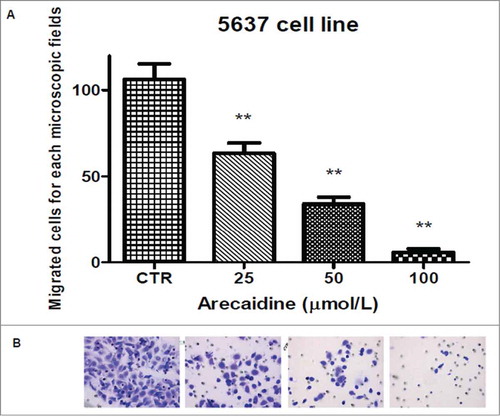
Figure 8. The M2 agonist Arecaidine inhibits in vitro cell migration of 5637 cell line. (A) Graph showing that 25, 50 and 100 μM of Arecaidine were able to significantly decrease the number of migrated cells. (B). Representative microscopic fields of 5637 cell migration across an 8 μm pore size filter in absence and in presence of 25, 50 and 100 μM Arecaidine for 21 hours. Magnification 25×. The bars represent the mean ± SD. **P < 0.01 vs. untreated cells. CTR, control.