Figures & data
Figure 1. Rapamycin blunts the p53 response to Act D. (A) U2OS cells were treated with single administrations of Act D (5 nM), nutlin-3 (10 μM) or rapamycin (100 nM) or in combinations as indicated in the figure. Cells were either pre-treated (pre.) with rapamycin for 6 hours before adding Act D or nutlin-3. Act D and nutlin-3 were also added simultaneously (simult.) with rapamycin. Cell extracts were prepared after 18 hours of incubation with the drugs and the relative levels of p53 and p21 determined by immunoblotting. β-actin served as a loading control. (B) Morphology of U2OS cells treated with Act D, rapamycin (R), and nutlin-3 and combinations before harvest for protein analysis. (C) Cell viability in U2OS cultures was measured by the MTT assay for the different treatment combinations. Equal numbers of cells were seeded in 6-well plates at the start of the experiment. The next day, control cells were mock-treated, while experimental cells were pre-treated with rapamycin (100 nM) for 6 hours and thereafter Act D (5 nM) and nutlin-3 (10 μM) respectively was added to the cells for 18 hours. MTT assay was carried out and absorbance was measured and expressed in arbitrary units (a.u). Shown is the mean ± SD derived from 3 independent experiments each conducted in triplicate. The paired t-test was used to determine any statistical significance between rapamycin and rapamycin + Act D treated cell cultures (* p < 0.05). (D) Effect of Act D, nutlin-3 and rapamycin on cell proliferation. Shown is the mean ± SD based on 3 independent experiments each performed in triplicate. The number of cells on control dishes was set to 100%. The paired t-test was used to calculate any statistical significance between nutlin-3 and nutlin-3 + rapamycin treated cells (* p < 0.05). (E) Effect of Act D, nutlin-3, rapamycin or combinations of the drugs on the cell cycle profile of U2OS cells according to FACS-PI analysis. (F) Percentage of S-phase cells according to FACS-PI for the different treatments (mean ± SD, **p < 0.01 ).
Figure 2. Rapamycin impairs the p53 response to nucleolar stress. (A) U2OS cells growing on coverslips in 6-well plates were exposed to mycophenolic acid (MPA, 10 μM), 5-fluorouracil (5-FU, 25 μM), doxorubicin (Dox, 1μM), or Act D (5 nM) overnight. Cells were immunostained for nucleolin (red), p53 (green) and counterstained with DAPI to visualize the nuclei (blue) in the upper panel. Objective 100x. In the lower panel 5-FU treated cells were stained for NPM1/B23 and fibrillarin. Objective 63x. (B) U2OS cells were pre-treated with rapamycin (100 nM) or DMSO (control) followed by addition of 5-FU (25 μM), MPA (10 μM) or Dox (1 μM). Protein extracts were made from the cells. Levels of p53 and p21 proteins were determined by immunoblotting. β-actin served as a loading control. (C) As in panel B but U343MGa Cl2:6 cells were used instead. (D) U2OS cells were treated with DMSO (control), 5nM Act D, 25 μM 5-FU, or 1 μM DOX alone or in combination with rapamycin (100 nM as simultaneous treatment) for a total of 18 hours and then pulsed with BrdU for another 6 hours. Coverslips were fixed and immunostained for BrdU incorporation. Data represent a triplicate experiment with at least 200 cells scored per experiment and treatment combination. Shown is percent BrdU positive cells (mean ± SD, *p < 0.05, n.s. – non-significant).
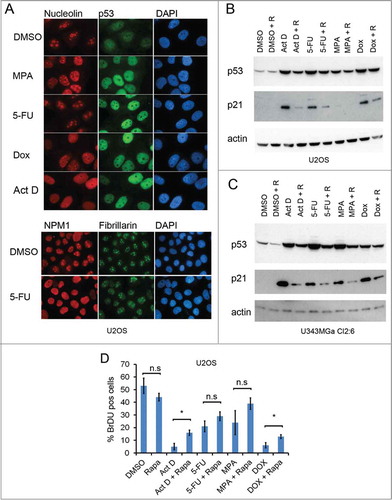
Figure 3. Synthetic mTOR inhibitors blunt the p53 response to nucleolar stress. (A) U2OS cells were treated overnight with temsirolimus (100 nM), PP242 (200 nM), LY294.002 (500 nM) or rapamycin (100 nM) and thereafter fixed and stained for nucleolin (red) and p53 (green). The DMSO vehicle was used as a control. Cells were counterstained with DAPI to visualize the nuclei. Objective 100x. (B) Cultures of U2OS cells were pre-treated with rapamycin for 6 hours (duplicate samples) at concentrations between 5 nM and 500 nM as indicated in the figure. One of the sample sets was then exposed to medium containing Act D (5 nM) and all samples were incubated for another 18 hours. Relative levels of p53, p21 and p-S6K1 (Thr389) were determined by immunoblotting. (C) Similar to B, but U343MGa Cl2:6 cells were used instead. (D) Cultures of U2OS cells were treated with temsirolimus (duplicate samples) at concentrations between 50 nM and 10 μM as indicated for 6 hours. The second set of temsiroliumus treated samples was then also given Act D (5 nM) for the following 18 hours while the other set was exposed to DMSO (control vehicle). Protein extracts were made from each sample and the relative levels of p53, p21, total S6K1, and p-S6K1 (Thr389) were monitored. (E) Similar to panel B, but PP242 was used instead of temsirolimus. (F) U2OS cells were treated with Act D (5 nM) or nutlin-3 (10 μM) alone or in combinations with temsirolimus (100 nM), LY294.002 (500 nM) or PP242 (200 nM). The cells were pre-treated with the mTOR inhibitors for 6 hours before adding Act D or nutlin-3. Relative levels of p53 and p21 were determined by immunoblotting.
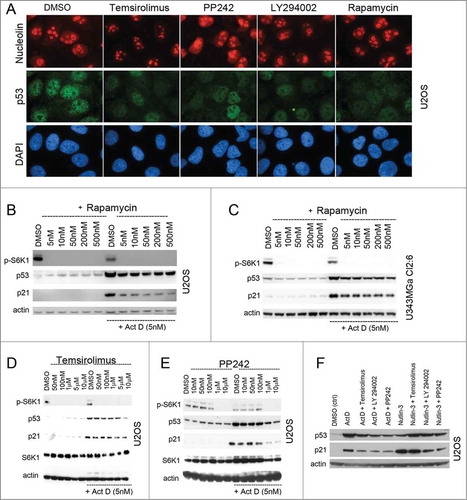
Figure 4. Natural compound inhibitors of the mTOR pathway and their effect on the levels of p53 and p21 alone or following nucleolar stress. (A) U2OS cells were pre-treated with rapamycin and natural compound inhibitors for 6 hours in duplicate samples and thereafter one of these sample sets was treated with Act D and incubated for an additional 18 hours. Cells were harvested, protein lysates prepared, and the relative levels of p53, p21, S6K1, and p-S6K1 (Thr389) were determined by immunoblotting. β-actin served as a loading control. Concentrations of compounds were as follows; rapamycin 2.74 μM; wortmannin 0.4 μM; caffeine 1 mM; resveratrol 25 μM; curcumin 20 μM; EGCG 25 μM; and Act D 5 nM. (B) Morphology of U2OS cells treated with the indicated compounds. (C) U2OS cells were treated for 18 hours with a low (5 nM) or high (1 μM) concentration of Act D and subsequently immunofluorescence stained for cleaved caspase-3. (D) Quantification of cleaved caspase-3 positive cells in different treatments. Approximately 1000 cells in 3 different low power fields were evaluated for each treatment and results are presented as % cleaved caspase-3 positive cells (mean ± SD). (E) U343MGa Cl2:6 glioma cells were pre-treated with rapamycin or various natural compounds for 6 hours and then actinomycin D (5 nM) was added as indicated. Cells were harvested, proteins extracted and the levels of p53 and p21 relative to the DMSO control were determined by immunoblotting. Concentrations of the compounds used were as follows; rapamycin 2.74 μM; wortmannin 0.4 μM; caffeine 1 mM; resveratrol 25 μM; curcumin 20 μM; EGCG 25 μM; dexamethasone 1 mM; and actinomycin D 5 nM. Dexamethasone (Dex) was included in this experiment as a possible regulator of p53.Citation73
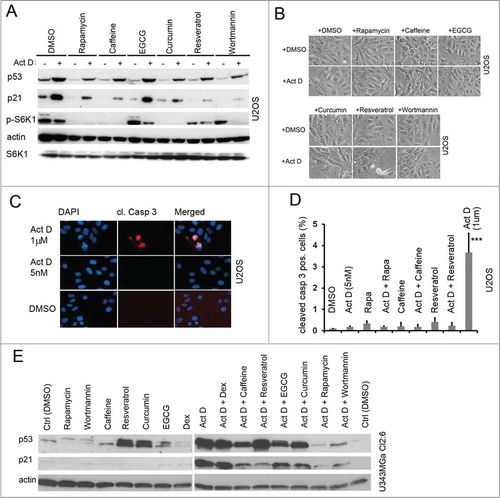
Figure 5. Caffeine inhibits the p53 response to nucleolar stress. (A) U2OS cells were pre-treated for 12 hours with caffeine at concentrations between 50 μM and 3 mM in duplicate. One set of caffeine treated samples was then given Act D (5 nM) and then all samples were incubated for another 18 hours. Relative levels of p53 and p21 were determined by immunoblotting. Level of tubulin was used as a loading control. (B) U2OS cells were treated with combinations of caffeine (3 mM) and Act D (5 nM) or 5-FU (25 μM). Relative levels of p53 and p21 were determined by immunoblotting with β-actin as a loading control. (C) Cultures of U343MGa Cl2:6 cells were pre-treated with caffeine (duplicate samples) at concentrations between 50 μM and 5 mM as indicated in the figure. One of the sample sets was then exposed to medium containing Act D (5 nM) and all samples were incubated for another 18 hours. Relative levels of p53, p21 and p-S6K1 (Thr389) were determined by immunoblotting.
Figure 6. Silencing of RPL11 mimics the effect of rapamycin on the p53/21 response to nucleolar stress. (A) Combined siRNA/Act D experiment conducted in a sequential fashion. At zero time point U2OS cells were transfected with siRNA directed against RPL11 or siCtrl (final concentration 20 nM). After 18 hours the cells were treated with Act D (5 nM) and some of the samples as indicated were at this time transfected with siRNA targeting MDM2 (siMDM2). After an additional 18 hours of incubation the cells were harvested and extracted of proteins and level of MDM2, p21, p53, β-actin and RPL11 determined by immunoblotting (36 hours after time zero). (B) U2OS cells were transfected with siRNA-1 targeting RPL11 or siCtrl overnight. Cells were thereafter treated with nutlin-3 (10 μM) or Act D (5 nM) for an additional 18 hours. The blotting membrane was probed for RPL11, MDM2, p53, p21, and β-actin. (C) Real-time quantitative PCR (qRT-PCR) was employed to measure relative p21 mRNA levels (a.u, arbitrary units). U2OS cells were treated with rapamycin, rapamycin + Act D, or transfected with siRNA targeting RPL11 (siRPL11–1) and total RNA was prepared. Expression of p21 mRNA was normalized to that of GAPDH mRNA for each sample. (D) Similar to C, but U343MGa Cl2:6 cells were used.
Figure 7. Regulation of RPL11 and MDM2 levels by rapamycin. (A) Schematic drawing of the interplay between mTOR and p53 pathways, indicating the potential role of mTOR in regulating MDM2 function through increased RPL11 synthesis in situations of nucleolar stress. (B) MDM2-RPL11 co-immunoprecipitation revealed a reduced complex formation of MDM2-RPL11 in cells treated with rapamycin and Act D (5nM) compared to cells treated with Act D only. Mouse monoclonal anti-MDM2 (SMP14) was used to immunoprecipitate MDM2 overnight and a rabbit polyclonal was used to detect RPL11 by immunoblotting. MDM2 was detected with SMP14. The DMSO control lane was cut from a distant part of the same gel blot and same exposure lenghts. (C) A CHX half-life assay was conducted to analyze the degradation rate of p53 in cells treated with Act D alone or in combination with either rapamycin or RPL11 siRNA. CHX (50 μg/ml final concentration) was added to the medium for the time points indicated. Exposures of the p53 blots were chosen to facilitate comparison of p53 degradation by showing a p53 signal at the zero time point as similar as possible in the 3 different blots. (D) Levels of p53 in U2OS cells treated with Act D only or Act D in combination with rapamycin (R, 100 nM), RPL11 siRNA, or RPL11 siRNA in a combination with rapamycin. (E) U2OS cells were treated with Act D (5 nM), rapamycin (2.74 μM), or a combination of Act D and rapamycin. Levels of p53 and RPL11 were determined by immunoblotting relative to β-actin loading control. (F) U343MGa Cl2:6 cells were treated with Act D (5 nM), rapamycin (2.74 μM), or a combination of Act D and rapamycin. PP242 (200 nM) was also included alone or in combination with Act D. Levels of p53 and RPL11 were determined by immunoblotting relative to β-actin loading control. (G) Phase contrast images of U2OS cells depicting the nucleolar morphology. Nucleoli are indicated with white arrows. (H) U2OS and Cl2:6 cells respectively growing on coverslips in 6-well plates were exposed to rapamycin for 30 hours. Cells were immunostained for NPM1/B23 and counterstained with DAPI to visualize the nuclei. (I) Quantification of nucleolar areas in U2OS and Cl2:6 cells treated with rapamycin. The average total nucleolar area per cell is shown as % of the control cell area. Nucleoli from at least 30 cells were evaluated for each treatment and cell type (**, p<0 .01).
Figure 8. Altered levels of total and phosphorylated MDM2 in rapamycin treated cells. (A) Levels of MDM2, p-Ser166 MDM2, p53, and p21 proteins in U2OS cells exposed to rapamycin (10 nM – 200 nM) for 18 hours. (B) MDM2, p-Ser166 MDM2, p53, and p21 protein levels in U343MGa Cl2:6 cells exposed to rapamycin (10 nM – 200 nM) for 18 hours (long exp., = long exposure). Total and p-Ser166 MDM2 levels were monitored on 2 different blots but using the same cell lysates.