Figures & data
Table 1. Maximum specific growth rate (h−1) and doubling time (h) of PC 3 and DU 145 Data shown are means ± SD.
Figure 1. Morphological comparison of PC 3 (A) and DU 145 (B) cell lines. Both cells lines showed epithelial morphology and adherence to plastic culture plates; DU 145 cells were smaller, rounded cells, while PC 3 cells were larger, with more cytoplasmic extensions. Scale bar, 100 μm.
Figure 2. Proliferation curves for PC 3 and DU 145 cells lines. The curves were obtained analyzing, by counting, 3 different untreated wells for each of the 3 experiments. Data shown are means ± SEM.
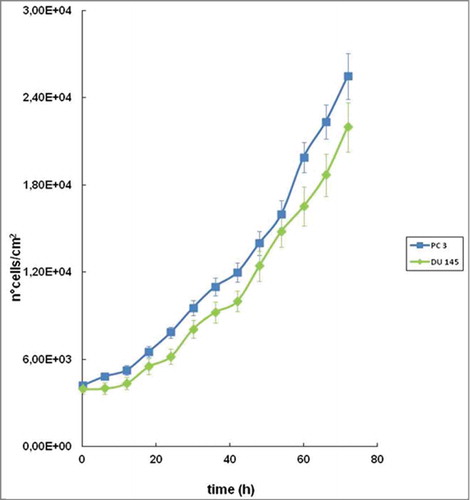
Figure 3. Representative time-lapse images of PC3 cells for a qualitative comparison of ZOL delivery systems. Pictures were taken at 24 h intervals over 72 h. LIPOs and NPs formulation act strongly decreasing cell proliferation rate, if compared with free ZOL. Scale bar, 100 μm.
Figure 4. Data represent the fold increase of the number of cells under different stimuli. LIPOs and NPs formulations enhanced the anti-proliferative effect of ZOL, compared with free ZOL and CTR. Each condition was assayed in the same experiment in triplicate and the average of the results of 3 independent experiments were reported. Data shown are means ± SEM;***p < 0.001 (CTR versus free ZOL, LIPOs, and NPs).
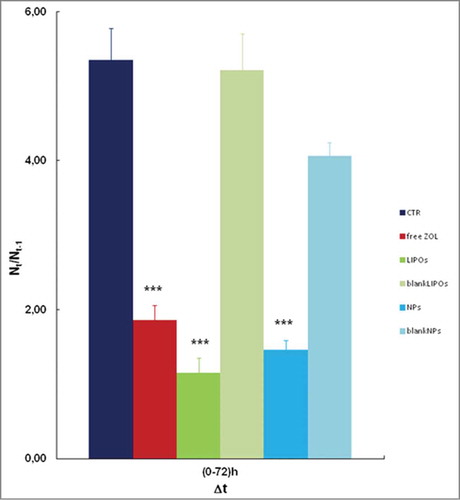
Figure 5. Representative time-lapse images of DU 145 cells for a qualitative comparison of ZOL delivery systems. Pictures were taken at 24 h intervals over 72 h. LIPOs seemed to act as the stronger anti-proliferative agent if compared to NPs and free ZOL. Scale bar, 100 μm.
Figure 6. Data represent the fold increase of the number of cells under different stimuli. LIPOs enhanced the anti-proliferative effect of ZOL compared to free ZOL and NPs formulation. Each condition was assayed in the same experiment in triplicate and the average of the results of 3 independent experiments were reported. Data shown are means ± SEM;***p < 0.001 (CTR vs. free ZOL, LIPOs, and NPs).
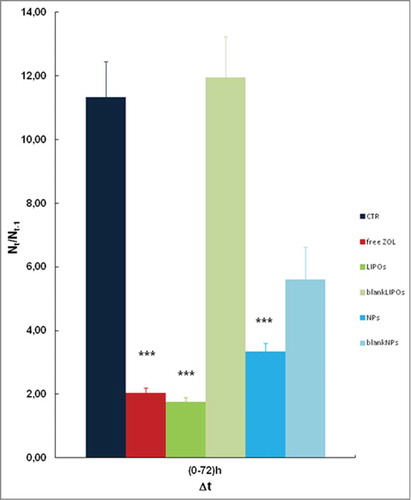
Figure 7. Representative time-lapse images of EPN cells for a qualitative comparison of ZOL delivery systems. Pictures were taken at 24 h intervals. Scale bar, 100 μm.
Figure 8. Data represent the fold increase of the number of cells under different stimuli. There are no significative differences between the treatments and the control. The data represent an average of triplicate repeats; data shown are means ± SD.
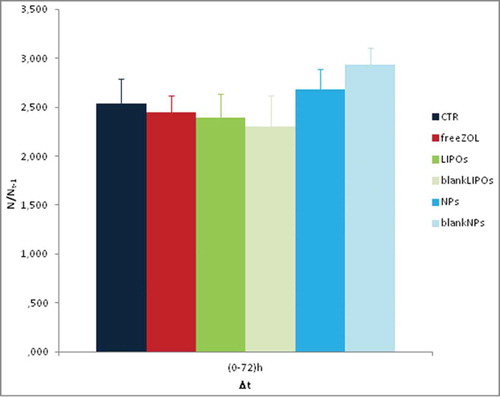
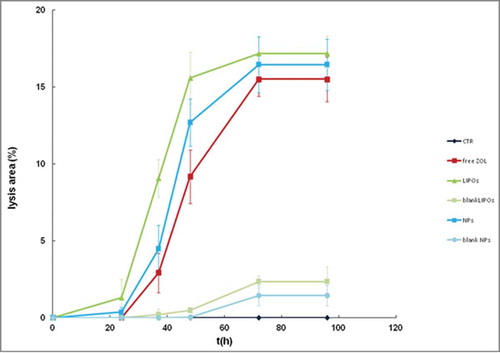
Figure 9. Representative time-lapse images show the progression of cytotoxic effect on a monolayer of DU 145 throughout the entire experiment. Cells treated with LIPOs were lysed more than other. Scale bar, 100 μm. For the kinetic analysis of the data please see also movies added to the present manuscript as supplemental files available on the web site of the journal. Legend: CTR3.avi: Untreated cells; AZ9.avi: ZOL-treated DU145 cells; Lip17.avi: LIPO-ZOL-treated DU145 cells; Nano33.avi: NP-ZOL-treated DU145 cells.
Figure 10. Kinetics of lysis. The graph reported the lysis area appearing on a confluent monolayer of DU 145 cells. LIPOs formulation showed the stronger effect compared to free ZOL and NPs (%). In the cytotoxicity assays, cell treatments were assessed in triplicate and the averaged results of 3 independent experiments are reported.