Figures & data
Figure 1. BNC105P and targeted therapy treatment suppresses vasculature recovery in MDA-MB-231 xenograft. Tumors were grown to an average of ∼360 mm3. On day 1 of treatment, animals (n = 10/group) were treated once with saline, bevacizumab, BNC105P or bevacizumab and BNC105P. (A) IHC of secreted VEGF-A 30hrs post-BNC105P in tumor sections. (B) H33342 composite fluorescent images in tumor sections post-BNC105P. (C) Percentage H33342 perfusion ± SEM. Significant (*P < 0 .05, **P < 0 .01, P < ***0.001) decrease in perfusion indicated.
Figure 2. The combination of BNC105P with bevacizumab results in significant tumor growth inhibition of MDA-MB-231 xenografts in female Balb/c nude mice. Tumors were grown to approximately 300 mm3 prior to treatment. On day 1 of treatment, animals (n = 10/group) were treated with either saline, BNC105P, bevacizumab or BNC105P and bevacizumab. Mean ± SEM represented. Significant inhibition of tumor growth by the combination compared to BNC105 (*) and Bevacizumab (ᵼ) indicated.
Figure 3. Molecular and cellular events associated with BNC105 induced vascular disruption and tumor recovery. (A) IHC showing DAB detection of ph-mTOR and ph-4E-BP-1 in the viable rim of Caki-1 tumors 24 hours post 32 mg/kg BNC105P. Upper panel of each indicates treatment with saline only. (B) H33342 fluorescent images of Renca orthotopic tumors (composite images) and metastatic lung lesions (Met.). Slides post-stained with H&E. (C) IHC showing Fast Red detection in representative viable tumor sections 24 hours post 32 mg/kg BNC105P or saline treatment. Control indicates detection antibody used only. (D) IHC showing Fast Red detection of secreted VEGF-A in Renca orthotopic tumors (composite image) 24 and 48 hours post 32 mg/kg BNC105P.
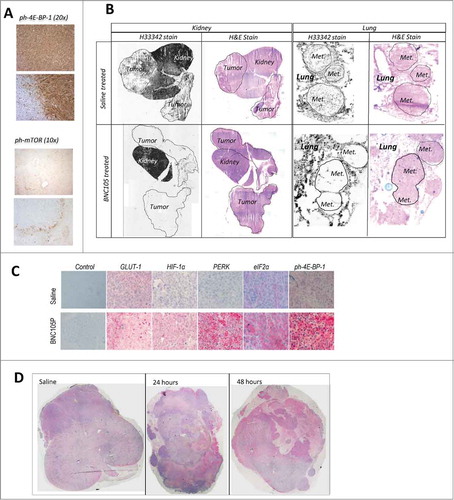
Figure 4. The combination of BNC105 with pazopanib significantly increases overall survival in an orthotopic model of renal cancer. On day 1 of treatment, animals (n = 10/group) were treated with either saline, vehicle, pazopanib, BNC105P or pazopanib and BNC105P for 21 d. The combination of BNC105 with pazopanib significantly increased overall survival compared to monotherapies (P < 0.0001).
Figure 5. Inhibition of mTOR with everolimus results in synergistic tumor growth inhibition. (A) Tumors were grown to approximately 120–180 mm3. On day 1 of treatment, animals (n = 10/group) were treated with either saline, everolimus, BNC105P or everolimus and BNC105 for 21 d A significant reduction in tumor size compared to everolimus alone was observed Day 9 and 10 (p < 0.05). (B) Overall survival.