Figures & data
Figure 1. Effect of inhibitors on AXL phosphorylation in TNBC cell lines. Serum starved MDA-MB-231 (top), Hs578T (middle) and BT549 (bottom) cells were treated with the correspondent inhibitor concentration. After 1 h incubation with the inhibitor the cells were stimulated with 250 ng/ml Gas6 for 30 min. Phosphorylation of AXL RTK was measured by pY-AXL-ELISA. The IC50 values were determined as percentage of the untreated DMSO control. The results shown are means and standard deviation calculated from 3 independent experiments. The strongest inhibitory effect on AXL phosphorylation was achieved by BMS777607 followed by MPCD84111 and SKI606.
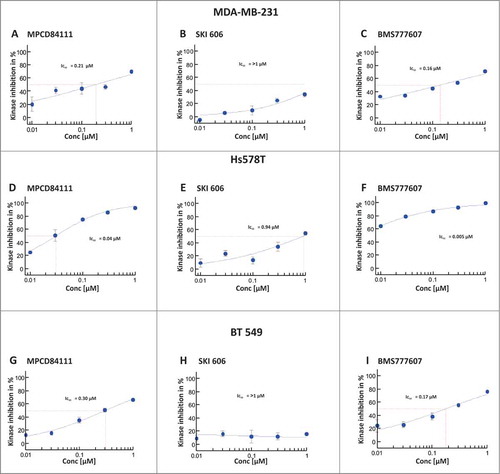
Figure 2. Effect of AXL TKIs on the migration of TNBC cell lines. The impact of MPCD84111, SKI606 and BMS777607 on cell motility was analyzed with Boyden chamber assay. The cells were allowed to migrate toward to the 1% FCS containing lower chamber for 3.5 h. MDA-MB-231 (top) and BT549 (bottom) were more sensitive to TKI treatment than Hs578T cells (middle). Among the 3 analyzed AXL TKIs SKI606 had the lowest IC50 value for migration inhibition. The IC50 values were determined as percentage of the untreated DMSO control. The results shown are means and standard deviation calculated from 3 independent experiments.
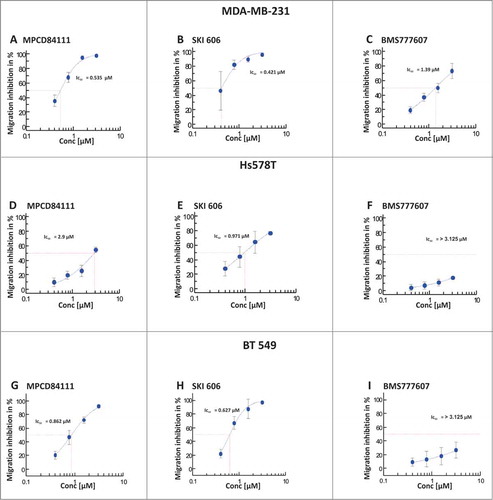
Figure 3. Effect of AXL TKIs on the viability of TNBC cells. The cell viability of the inhibitor treated MDA-MB-231, Hs578T and BT549 was determined after 72 h. The IC50 values were calculated as a percentage of the untreated DMSO control. SKI606 and MPCD84111 show an inhibitory effect on Hs578T (middle) and BT549 (bottom) viability. The MDA-MB-231 cell line (top) was less sensitive to TKI treatment showing efficient reduction of viability only after treatment with SKI606. The results shown are means and standard deviation taken from 3 independent experiments.
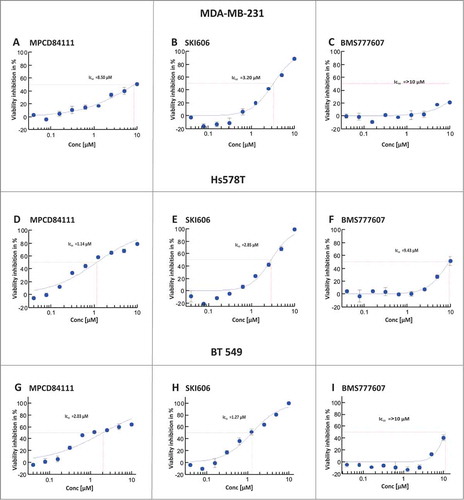
Table 1. Target profiles of SKI606 and MPCD84111. Tables show the Kd values of the proteins targeted by SKI606 (A) and MPCD84111 (B) in Hs578T cell lysates
Figure 4. The kinase selectivity profile of MPCD84111, BMS777607 and SKI606. The heatmap shows the activity of 84 kinase after treatment with 1 μM of MPCD84111, BMS777607 and SKI606. The scale indicates colors corresponding to kinase activities.
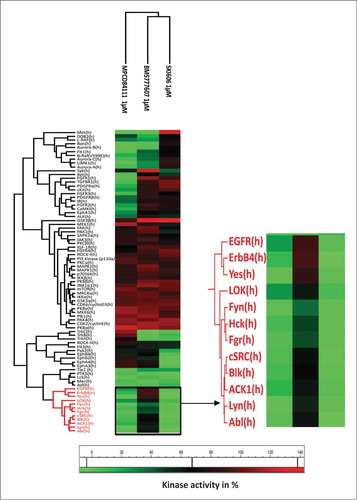
Figure 5. Effects of siRNA-mediated knockdown of Lyn and p130Cas on migration and viability of human TNBC cell lines. The knockdown of Lyn and p130Cas significantly reduced migration of MDA-MB-231, Hs578T and BT549 cells as determined by Boyden chamber assay (A). In MDA-MB-231 and Hs578T cell lines, knockdown of Lyn had no significant effect on the level of viability, while in BT549 cells all siRNA treatments had significant effects on the viability levels as determined by CellTiter-Glo assay (B). Knockdown of Lyn and p130Cas was confirmed by Western blot analysis (C). Tubulin represents the loading control. The results shown are means and standard deviation taken from 3 independent experiments.*, P ˂ 0.0001, Dunnett's Multiple Comparison Test.
Figure 6. Effect of AXL RTK inhibitors on intracellular signaling pathways. Immunoblots of lysates of MDA-MB-231 (A), Hs578T (B) and BT549 (C) starved cells treated with 1 μM of MPCD84111, SKI606 or BMS777607 for 1.5 or 48 h using antibodies against phospho-Pyk2 (pY580), phospho-FAK (pY576/577), phospho-p130Cas (pY410), phospho-Lyn (pY507), phospho-Src (pY416) and Tubulin (represents the loading control).