2,300
Views
69
CrossRef citations to date
0
Altmetric
RESEARCH PAPERS

Dasatinib reverses the multidrug resistance of breast cancer MCF-7 cells to doxorubicin by downregulating P-gp expression via inhibiting the activation of ERK signaling pathway

, , , , , , , , , & show all
Pages 106-114 | Received 13 Jul 2014, Accepted 09 Nov 2014, Published online: 18 Feb 2015

Figures & data

Figure 1. Characterization of MCF-7 and MCF-7/Adr cells. After treating cells with increasing concentrations of DOX in sensitive MCF-7 (○) and resistant MCF-7/Adr (•) cells for 48 h, cell viability was determined by MTT assay (A), mRNA expression of P-gp was tested by quantitative real-time PCR analysis (the control group is set at 1) (B) and P-gp protein level was detected by Western blot analysis (C). Data shown are means ± SD of triplicate determinations. ***P < 0.001, versus the control group.
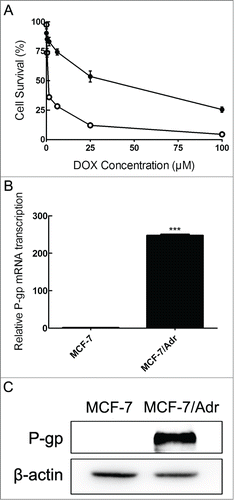
Figure 1. Characterization of MCF-7 and MCF-7/Adr cells. After treating cells with increasing concentrations of DOX in sensitive MCF-7 (○) and resistant MCF-7/Adr (•) cells for 48 h, cell viability was determined by MTT assay (A), mRNA expression of P-gp was tested by quantitative real-time PCR analysis (the control group is set at 1) (B) and P-gp protein level was detected by Western blot analysis (C). Data shown are means ± SD of triplicate determinations. ***P < 0.001, versus the control group.

Table 1. Effect of dasatinib on reversing P-gp-mediated MDR in drug selected cell line

Table 2. Effect of dasatinib on reversing P-gp-mediated MDR in transfected cell line

Figure 2. Effects of dasatinib on the accumulation and efflux of DOX. (A) Cells were pre-incubated with or without dasatinib or verapamil for 24 h at 37°C and then incubated with 20 μM DOX for another 1h at 37°C. The results are presented as fold change in fluorescence intensity relative to untreated control resistant cells. (B) After a preincubation of 20 μM DOX for 3 h, time course of DOX efflux was measured in MCF-7/Adr cells with the presence (•) or absence (○) of 1.0 μM dasatinib. The accumulation of DOX was measured by flow cytometric analysis. Data shown are means ± SD of triplicate determinations. *P < 0.05 and **P < 0.01 vs. the control group.
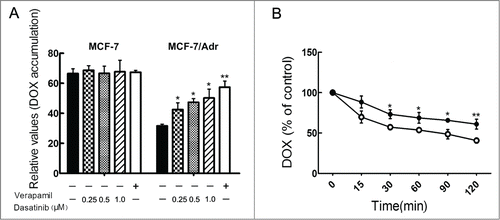
Figure 2. Effects of dasatinib on the accumulation and efflux of DOX. (A) Cells were pre-incubated with or without dasatinib or verapamil for 24 h at 37°C and then incubated with 20 μM DOX for another 1h at 37°C. The results are presented as fold change in fluorescence intensity relative to untreated control resistant cells. (B) After a preincubation of 20 μM DOX for 3 h, time course of DOX efflux was measured in MCF-7/Adr cells with the presence (•) or absence (○) of 1.0 μM dasatinib. The accumulation of DOX was measured by flow cytometric analysis. Data shown are means ± SD of triplicate determinations. *P < 0.05 and **P < 0.01 vs. the control group.

Figure 3. Effect of dasatinib on DOX-induced cell apoptosis. (A) After pre-incubating the cells with dasatinib for 24 h at 37°C, cells grown on coverslips were treated with the 20 μM DOX for another 48 h, and apoptosis was analyzed by TUNEL assay as described in Materials and Methods. (B) Quantification of TUNEL fluorescent images. After pre-incubating the cells with dasatinib for 24 h, cleaved caspase-3 expression was performed (C) with quantification (D). Each column shows the mean ± SD of 3 independent experiments, performed in triplicate. *P < 0.05 and **P < 0.01 versus the control group.
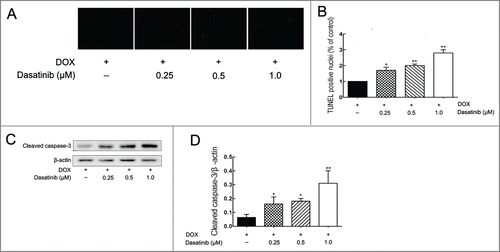
Figure 3. Effect of dasatinib on DOX-induced cell apoptosis. (A) After pre-incubating the cells with dasatinib for 24 h at 37°C, cells grown on coverslips were treated with the 20 μM DOX for another 48 h, and apoptosis was analyzed by TUNEL assay as described in Materials and Methods. (B) Quantification of TUNEL fluorescent images. After pre-incubating the cells with dasatinib for 24 h, cleaved caspase-3 expression was performed (C) with quantification (D). Each column shows the mean ± SD of 3 independent experiments, performed in triplicate. *P < 0.05 and **P < 0.01 versus the control group.

Figure 4. Effects of dasatinib on the mRNA and protein expressions of P-gp in resistant MCF-7/Adr cells. (A, B) Cells were treated with 1.0 μM dasatinib at the indicated time of 0, 12, 24, 48, 72 h, and dasatinib downregulated P-gp in a time-dependent manner before 24 h. (D, E) Cells were treated with 10 μM U0126 and dasatinib at the indicated concentrations of 0, 0.25, 0.5, 1.0 μM for 24 h, and dasatinib downregulated P-gp in a dose-dependent manner. (C, F) The protein expression of P-gp was normalized to β-actin. Each column shows the mean ± SD of 3 independent experiments, performed in triplicate. *P < 0.05 and **P < 0.01, vs. the control group.
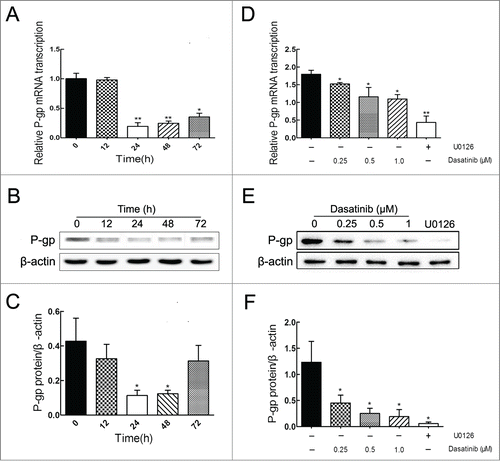
Figure 4. Effects of dasatinib on the mRNA and protein expressions of P-gp in resistant MCF-7/Adr cells. (A, B) Cells were treated with 1.0 μM dasatinib at the indicated time of 0, 12, 24, 48, 72 h, and dasatinib downregulated P-gp in a time-dependent manner before 24 h. (D, E) Cells were treated with 10 μM U0126 and dasatinib at the indicated concentrations of 0, 0.25, 0.5, 1.0 μM for 24 h, and dasatinib downregulated P-gp in a dose-dependent manner. (C, F) The protein expression of P-gp was normalized to β-actin. Each column shows the mean ± SD of 3 independent experiments, performed in triplicate. *P < 0.05 and **P < 0.01, vs. the control group.

Figure 5. Effect of dasatinib on the expression of phospho-ERK. P-ERK expression was assayed with the treatment of 1.0 μM dasatinib at the indicated time of 0, 12, 24, 48, 72 h (A) and at the indicated concentrations of 0, 0.25, 0.5, 1.0 μM for 24 h (C). U0126 acts as the positive control group. (B, D) The quantification of P-ERK expression was normalized to the total content of ERK. Each column shows the mean ± SD of 3 independent experiments, performed in triplicate. *P < 0.05 and **P < 0.01, versus the control group.
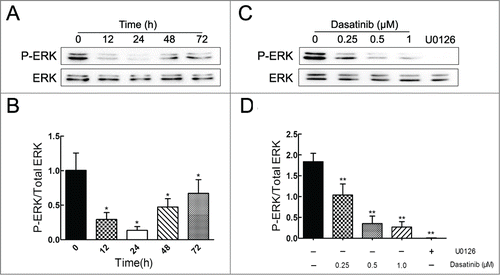
Figure 5. Effect of dasatinib on the expression of phospho-ERK. P-ERK expression was assayed with the treatment of 1.0 μM dasatinib at the indicated time of 0, 12, 24, 48, 72 h (A) and at the indicated concentrations of 0, 0.25, 0.5, 1.0 μM for 24 h (C). U0126 acts as the positive control group. (B, D) The quantification of P-ERK expression was normalized to the total content of ERK. Each column shows the mean ± SD of 3 independent experiments, performed in triplicate. *P < 0.05 and **P < 0.01, versus the control group.
Supplemental material

987062_Supplementary_Materials.zip

Download Zip (1.3 MB)

Reprints and Corporate Permissions

Please note: Selecting permissions does not provide access to the full text of the article, please see our help page How do I view content?

To request a reprint or corporate permissions for this article, please click on the relevant link below:

Academic Permissions

Please note: Selecting permissions does not provide access to the full text of the article, please see our help page How do I view content?

Obtain permissions instantly via Rightslink by clicking on the button below:

If you are unable to obtain permissions via Rightslink, please complete and submit this Permissions form. For more information, please visit our Permissions help page.