1,912
Views
22
CrossRef citations to date
0
Altmetric
Reports

Targeted deletion of the ara operon of Salmonella typhimurium enhances L-arabinose accumulation and drives PBAD-promoted expression of anti-cancer toxins and imaging agents

, , , , , , & show all
Pages 3112-3120 | Received 30 Apr 2014, Accepted 16 Jul 2014, Published online: 30 Oct 2014

Figures & data

Figure 1. Deletion of the ara operon. (A) Schematic representation of the ara operon in S. typhimurium and the metabolic pathway by which enzymes encoded by the ara operon metabolize L-arabinose. (B) Diagram of PCR to confirm recombination between the ara operon and an antibiotic-resistance gene using pairs of primers (P1 and C2 or C1 and P2). (C) Diagram of PCR to confirm deletion of the ara operon using the C3 and P2 primers. Cat, chloramphenicol acetyltransferase. (D) Sequence of the ara operon showing the precise positions of primers used for targeted deletion of ara operon and for PCR verification.
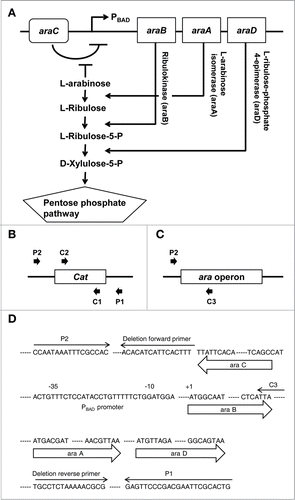
Figure 1. Deletion of the ara operon. (A) Schematic representation of the ara operon in S. typhimurium and the metabolic pathway by which enzymes encoded by the ara operon metabolize L-arabinose. (B) Diagram of PCR to confirm recombination between the ara operon and an antibiotic-resistance gene using pairs of primers (P1 and C2 or C1 and P2). (C) Diagram of PCR to confirm deletion of the ara operon using the C3 and P2 primers. Cat, chloramphenicol acetyltransferase. (D) Sequence of the ara operon showing the precise positions of primers used for targeted deletion of ara operon and for PCR verification.

Figure 2. In vitro characteristics of ara operon-deleted S. typhimurium. (A) Bacterial growth curves. Growth was assessed for ΔppGpp S. typhimurium (SL) and ara operon-deleted ΔppGpp S. typhimurium (SLΔARA). SL and SLΔARA was transformed with pClyA (SL-pClyA and SLΔARA-pClyA). SL-pClyA (-) or SLΔARA-pClyA (-) indicates without induction, while SL-pClyA (+) or SLΔARA-pClyA (+) indicates with induction by 0.002% or 0.2% L-arabinose. L-arabinose was added to the growth medium at 1.5 h. (B) SL and SLΔARA were transformed with pRLuc8. Various concentrations (0–0.4%) of L-arabinose were added to fresh bacterial cultures (after 1.5 h of culture) when the OD600 was 0.5–0.7. After 4.5 h incubation, ∼8 × 10⁷ bacteria were collected for the luciferase assay (n = 5 per group). Bioluminescence, indicative of RLuc8 expression, was detected using a luminometer.
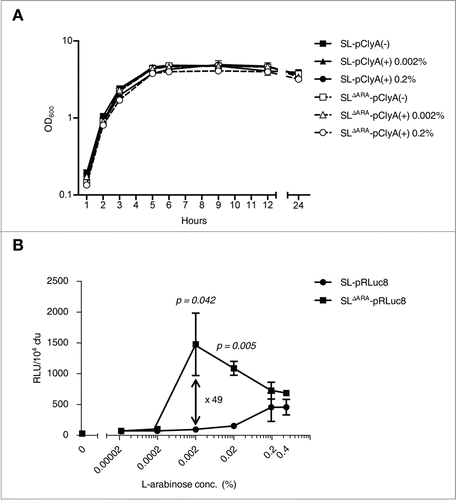
Figure 2. In vitro characteristics of ara operon-deleted S. typhimurium. (A) Bacterial growth curves. Growth was assessed for ΔppGpp S. typhimurium (SL) and ara operon-deleted ΔppGpp S. typhimurium (SLΔARA). SL and SLΔARA was transformed with pClyA (SL-pClyA and SLΔARA-pClyA). SL-pClyA (-) or SLΔARA-pClyA (-) indicates without induction, while SL-pClyA (+) or SLΔARA-pClyA (+) indicates with induction by 0.002% or 0.2% L-arabinose. L-arabinose was added to the growth medium at 1.5 h. (B) SL and SLΔARA were transformed with pRLuc8. Various concentrations (0–0.4%) of L-arabinose were added to fresh bacterial cultures (after 1.5 h of culture) when the OD600 was 0.5–0.7. After 4.5 h incubation, ∼8 × 10⁷ bacteria were collected for the luciferase assay (n = 5 per group). Bioluminescence, indicative of RLuc8 expression, was detected using a luminometer.

Figure 3. Bacterial bioluminescence and RLuc8 expression in colonized tumors. (A and B) In vivo expression of RLuc8 in tumors colonized by bacteria at 6 d post inoculum (dpi). BALB/c mice were inoculated subcutaneously with CT26 cells (1 × 10⁶) and then injected with SL or SLΔARA carrying pBAD-RLuc8 (SL- pRLuc8 and SLΔARA- pRLuc8). Mice received an intraperitoneal injection of 120 mg (A) or 12 mg (B). L-arabinose at 3 dpi. Bioluminescence imaging was performed following intravenous injection of coelenterazine (0.7 mg/kg). A region of interest was selected manually to quantify photon flux. The region of interest area was kept constant, and the maximum intensity within this area was recorded (photons·s−1·cm−2·sr−1).
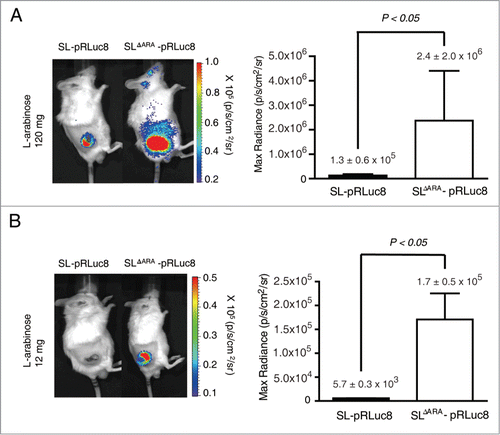
Figure 3. Bacterial bioluminescence and RLuc8 expression in colonized tumors. (A and B) In vivo expression of RLuc8 in tumors colonized by bacteria at 6 d post inoculum (dpi). BALB/c mice were inoculated subcutaneously with CT26 cells (1 × 10⁶) and then injected with SL or SLΔARA carrying pBAD-RLuc8 (SL- pRLuc8 and SLΔARA- pRLuc8). Mice received an intraperitoneal injection of 120 mg (A) or 12 mg (B). L-arabinose at 3 dpi. Bioluminescence imaging was performed following intravenous injection of coelenterazine (0.7 mg/kg). A region of interest was selected manually to quantify photon flux. The region of interest area was kept constant, and the maximum intensity within this area was recorded (photons·s−1·cm−2·sr−1).

Figure 4. L-arabinose-induced expression and secretion of ClyA in ara operon-deleted S. typhimurium. SL and SLΔara were transformed with pClyA. (A) Expression and secretion of ClyA (34 kDa) from both transformed strains (SL- pClyA and SLΔARA- pClyA) was verified by immunoblotting using an anti-ClyA antibody. Bacterial pellets (Pellet) and filtered culture medium (Filtrate) were collected at 4.5 hour after induction at 1.5 hours with or without 0.2% L-arabinose. Arrows indicate ClyA. Upper panel is Ponseau S staining. (B) Cytotoxicity due to secretion of ClyA from transformed bacteria. SL- pClyA and SLΔARA- pClyA were grown in the presence (+) or absence (-) of L-arabinose. The bacterial spent medium was filtered (0.2 μm filter), centrifuged (3,000 × g for 5 min), and concentrated to 20 mg/ml using a concentrator. The cytotoxic effects of the concentrated bacterial supernatant (0.2 mg protein) were tested using cultured CT26 cells (1 × 10⁴). Cell death was determined using an MTT assay kit (n = 5 per group).
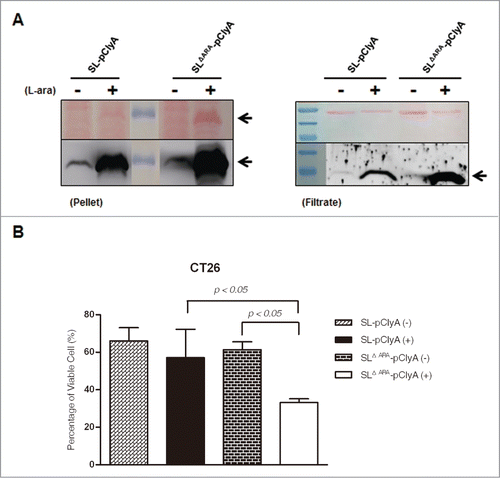
Figure 4. L-arabinose-induced expression and secretion of ClyA in ara operon-deleted S. typhimurium. SL and SLΔara were transformed with pClyA. (A) Expression and secretion of ClyA (34 kDa) from both transformed strains (SL- pClyA and SLΔARA- pClyA) was verified by immunoblotting using an anti-ClyA antibody. Bacterial pellets (Pellet) and filtered culture medium (Filtrate) were collected at 4.5 hour after induction at 1.5 hours with or without 0.2% L-arabinose. Arrows indicate ClyA. Upper panel is Ponseau S staining. (B) Cytotoxicity due to secretion of ClyA from transformed bacteria. SL- pClyA and SLΔARA- pClyA were grown in the presence (+) or absence (-) of L-arabinose. The bacterial spent medium was filtered (0.2 μm filter), centrifuged (3,000 × g for 5 min), and concentrated to 20 mg/ml using a concentrator. The cytotoxic effects of the concentrated bacterial supernatant (0.2 mg protein) were tested using cultured CT26 cells (1 × 10⁴). Cell death was determined using an MTT assay kit (n = 5 per group).

Figure 5. Effect of ara operon-deleted S. typhimurium on tumor growth. BALB/c mice were inoculated subcutaneously with CT26 cells (1 × 10⁶). When the tumor volume reached ∼120 mm3, mice were injected with PBS (n = 6), SL carrying pClyA (SL- pClyA, n = 6), or SLΔARA carrying pClyA (SLΔARA- pClyA, n = 7), but were not treated with L-arabinose (-). In separate groups (n = 8 per group), mice were injected with SL- pClyA or SLΔARA- pClyA, and then received a daily intraperitoneal injection of 120 mg L-arabinose (+), starting 3 d after they had received the bacteria. (A) Changes in tumor volume. * P = 0.04 (PBS vs. SL-pClyA (-) or SLΔARA- pClyA (-) at day 15, SL- pClyA (+) vs. SLΔARA- pClyA (+) at day 24), ** P = 0.03 (SL-pClyA (-) vs. SL-pClyA (+) at day 21, SLΔARA- pClyA (-) vs. SLΔARA- pClyA (+) at day 21, SL-pClyA (-) vs. SLΔARA- pClyA (+) at day 21) (B) Images of subcutaneous tumors in representative mice. (C) Western blot analysis of the 34 kDa ClyA protein from CT26 tumor tissues of mice injected with SL- pClyA or SLΔARA- pClyA, and with or without L-arabinose induction.
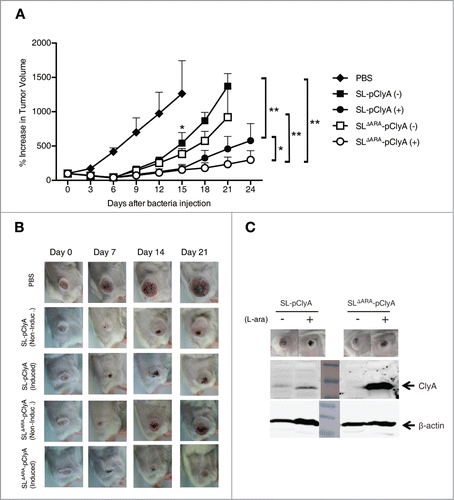
Figure 5. Effect of ara operon-deleted S. typhimurium on tumor growth. BALB/c mice were inoculated subcutaneously with CT26 cells (1 × 10⁶). When the tumor volume reached ∼120 mm3, mice were injected with PBS (n = 6), SL carrying pClyA (SL- pClyA, n = 6), or SLΔARA carrying pClyA (SLΔARA- pClyA, n = 7), but were not treated with L-arabinose (-). In separate groups (n = 8 per group), mice were injected with SL- pClyA or SLΔARA- pClyA, and then received a daily intraperitoneal injection of 120 mg L-arabinose (+), starting 3 d after they had received the bacteria. (A) Changes in tumor volume. * P = 0.04 (PBS vs. SL-pClyA (-) or SLΔARA- pClyA (-) at day 15, SL- pClyA (+) vs. SLΔARA- pClyA (+) at day 24), ** P = 0.03 (SL-pClyA (-) vs. SL-pClyA (+) at day 21, SLΔARA- pClyA (-) vs. SLΔARA- pClyA (+) at day 21, SL-pClyA (-) vs. SLΔARA- pClyA (+) at day 21) (B) Images of subcutaneous tumors in representative mice. (C) Western blot analysis of the 34 kDa ClyA protein from CT26 tumor tissues of mice injected with SL- pClyA or SLΔARA- pClyA, and with or without L-arabinose induction.

Table 1. Bacterial strains and plasmids used in this study

Table 2. Primer sequences used in this study

Supplemental material

949527_Supplementary_Materials.zip

Download Zip (1,004.1 KB)

Reprints and Corporate Permissions

Please note: Selecting permissions does not provide access to the full text of the article, please see our help page How do I view content?

To request a reprint or corporate permissions for this article, please click on the relevant link below:

Academic Permissions

Please note: Selecting permissions does not provide access to the full text of the article, please see our help page How do I view content?

Obtain permissions instantly via Rightslink by clicking on the button below:

If you are unable to obtain permissions via Rightslink, please complete and submit this Permissions form. For more information, please visit our Permissions help page.