1,336
Views
14
CrossRef citations to date
0
Altmetric
Reports

The spatio-temporal dynamics of PKA activity profile during mitosis and its correlation to chromosome segregation

, , , , , , & show all
Pages 3232-3240 | Received 13 Jun 2014, Accepted 28 Jul 2014, Published online: 06 Nov 2014

Figures & data

Figure 1. PKA activity increases during mitosis. YFP/CFP ratio (normalized on the average of the 5 first time point values), corresponding to PKA activity during the mitosis of one representative HeLa cell (black). At t = 4h45, when the division has occurred, the 2 curves correspond to each daughter cell (dark gray and light gray) (A). Pseudo color images representing YFP/CFP ratio around mitosis of the same cell from t = 2h35 to t = 5h10 (scale bar = 10μM) (B). For the functionality control of the AKAREV biosensor and of the inactive mutant AKAREV T>A, YFP/CFP ratio has been measured before (t = 0 to 8 min) and after (t = 10 to 22 min) the addition of forksolin (12.5 μM) to the imaging medium, (n = 20 for AKAREV; n = 11 for AKAREV T>A). An arrow indicates the time point where forskolin was added (C). Representative images for each condition in pseudo color scale (D). Histogram represents the average YFP/CFP ratio of AKAREV (n = 8) normalized on the values obtained with its inactive mutant AKAREV T>A (n = 8). This time, all the single curves has been normalized on the late G2/prophase step. Different cell cycle steps were isolated according to morphological criterions: late G2/prophase corresponds to the 5 time points before the cell become round, mitosis corresponds to the moment where the cell is effectively round, cytokinesis corresponds to the moment where the cell stretches out and start the constriction in 2 daughter cells, and early G1 corresponds to the 5 next points (E).
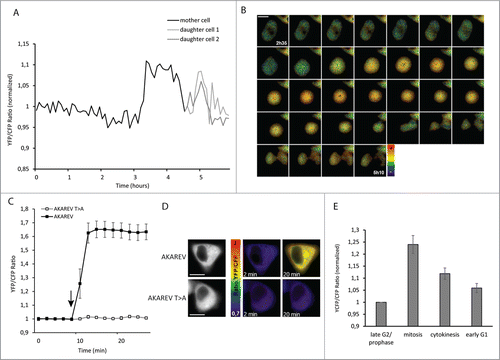
Figure 1. PKA activity increases during mitosis. YFP/CFP ratio (normalized on the average of the 5 first time point values), corresponding to PKA activity during the mitosis of one representative HeLa cell (black). At t = 4h45, when the division has occurred, the 2 curves correspond to each daughter cell (dark gray and light gray) (A). Pseudo color images representing YFP/CFP ratio around mitosis of the same cell from t = 2h35 to t = 5h10 (scale bar = 10μM) (B). For the functionality control of the AKAREV biosensor and of the inactive mutant AKAREV T>A, YFP/CFP ratio has been measured before (t = 0 to 8 min) and after (t = 10 to 22 min) the addition of forksolin (12.5 μM) to the imaging medium, (n = 20 for AKAREV; n = 11 for AKAREV T>A). An arrow indicates the time point where forskolin was added (C). Representative images for each condition in pseudo color scale (D). Histogram represents the average YFP/CFP ratio of AKAREV (n = 8) normalized on the values obtained with its inactive mutant AKAREV T>A (n = 8). This time, all the single curves has been normalized on the late G2/prophase step. Different cell cycle steps were isolated according to morphological criterions: late G2/prophase corresponds to the 5 time points before the cell become round, mitosis corresponds to the moment where the cell is effectively round, cytokinesis corresponds to the moment where the cell stretches out and start the constriction in 2 daughter cells, and early G1 corresponds to the 5 next points (E).

Figure 2. PKA localization during mitosis. HeLa cells at different mitotic stages from prophase to cytokinesis exhibiting a DNA staining (Hoechst, in blue, upper panel), a spindle staining (α-tubulin, in green, second panel) and a PKA catalytic sub-unit staining (in red, third panel). The lower panel represents the merge of the different channels. White arrows highlight the centrosomal regions where PKA catalytic sub-unit is more concentrated.
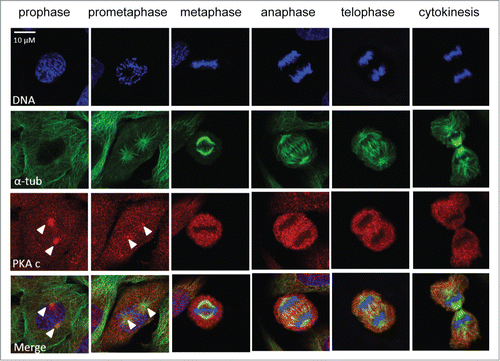
Figure 2. PKA localization during mitosis. HeLa cells at different mitotic stages from prophase to cytokinesis exhibiting a DNA staining (Hoechst, in blue, upper panel), a spindle staining (α-tubulin, in green, second panel) and a PKA catalytic sub-unit staining (in red, third panel). The lower panel represents the merge of the different channels. White arrows highlight the centrosomal regions where PKA catalytic sub-unit is more concentrated.

Figure 3. Sub-localization of PKA activity during metaphase and anaphase. Confocal FRET experiment of cells expressing the AKAREV biosensor during metaphase (A) and anaphase (C). White squares define the zoom in regions of the cell in metaphase (B) and in anaphase (D).The left panel is composed of intensity images, the center panel correspond to the FRET ratio images represented in a rainbow pseudo color scale and the right panel is the merge of the 2 images. To highlight the chromosome regions where PKA is highly active, we applied an inverted gray lookuptable on the zoom in images (B and D, left panel). Merge of intensity and FRET images in a metaphasic cell expressing AKAREV and treated with H-89 (10 μM), and another expressing the mutant AKAREV T>A (E).
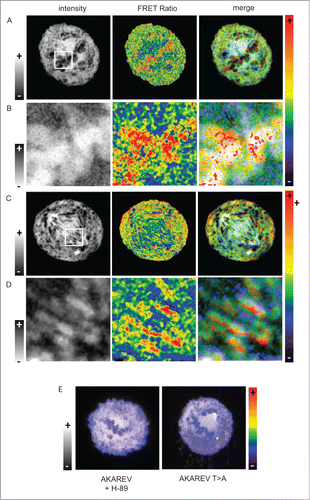
Figure 3. Sub-localization of PKA activity during metaphase and anaphase. Confocal FRET experiment of cells expressing the AKAREV biosensor during metaphase (A) and anaphase (C). White squares define the zoom in regions of the cell in metaphase (B) and in anaphase (D).The left panel is composed of intensity images, the center panel correspond to the FRET ratio images represented in a rainbow pseudo color scale and the right panel is the merge of the 2 images. To highlight the chromosome regions where PKA is highly active, we applied an inverted gray lookuptable on the zoom in images (B and D, left panel). Merge of intensity and FRET images in a metaphasic cell expressing AKAREV and treated with H-89 (10 μM), and another expressing the mutant AKAREV T>A (E).

Figure 4. Effects of PKA inhibition using H-89 during mitosis. Immunostaining of metaphasic HeLa cells synchronized using thymidine-nocodazole blocks. DNA was stained using Hoechst (upper panel, in red), spindle was stained using an α-tubulin antibody (second panel, in green). The lower panel represent the merge of the 2 channels. First column shows a metaphase in control conditions, the next columns show different kind of mitotic phenotypes observed upon inhibition of PKA activity using H-89 (10 μM). White arrows highlight chromosomes or pieces of DNA that have migrated precociously (A). Percentage of cells in each phase of mitosis defined according to phenotype, at 1 hour and 2 hour after release from a thymidine-nocdazole synchrony, in control and h-89 treated conditions (total number of cell measured on 4 independent experiments: n = 663, n = 632, n = 754 and n = 1195 for respectively control condition after 1h and 2h, H-89 condition after 1h and after 2h) (B). Percentage of mitotic defects observed in control and H-89 treated cells. Stars represent p-values obtained on a student t-test performed on the results of the 4 experiments with * < 0.05 and ** < 0.01 (C).
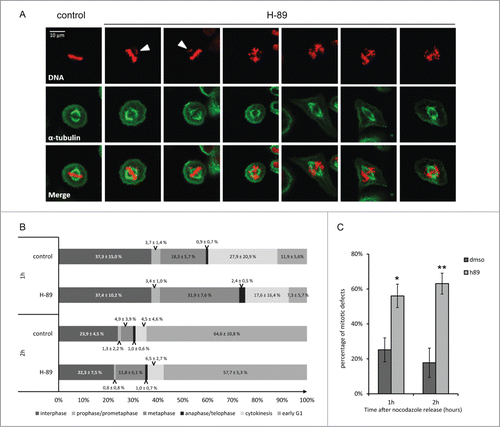
Figure 4. Effects of PKA inhibition using H-89 during mitosis. Immunostaining of metaphasic HeLa cells synchronized using thymidine-nocodazole blocks. DNA was stained using Hoechst (upper panel, in red), spindle was stained using an α-tubulin antibody (second panel, in green). The lower panel represent the merge of the 2 channels. First column shows a metaphase in control conditions, the next columns show different kind of mitotic phenotypes observed upon inhibition of PKA activity using H-89 (10 μM). White arrows highlight chromosomes or pieces of DNA that have migrated precociously (A). Percentage of cells in each phase of mitosis defined according to phenotype, at 1 hour and 2 hour after release from a thymidine-nocdazole synchrony, in control and h-89 treated conditions (total number of cell measured on 4 independent experiments: n = 663, n = 632, n = 754 and n = 1195 for respectively control condition after 1h and 2h, H-89 condition after 1h and after 2h) (B). Percentage of mitotic defects observed in control and H-89 treated cells. Stars represent p-values obtained on a student t-test performed on the results of the 4 experiments with * < 0.05 and ** < 0.01 (C).

Reprints and Corporate Permissions

Please note: Selecting permissions does not provide access to the full text of the article, please see our help page How do I view content?

To request a reprint or corporate permissions for this article, please click on the relevant link below:

Academic Permissions

Please note: Selecting permissions does not provide access to the full text of the article, please see our help page How do I view content?

Obtain permissions instantly via Rightslink by clicking on the button below:

If you are unable to obtain permissions via Rightslink, please complete and submit this Permissions form. For more information, please visit our Permissions help page.