
Figures & data
Figure 1. Two types of MCM3 genes in Xenopus and zebrafish. (A) Schematic structures of maternal and zygotic MCM3 proteins. (B) Comparison of primary structures of various MCM3 proteins. (C) Expression of Xenopus MCM genes during early development. cDNAs were prepared from oocytes, A6 cells or developing embryos, and expression of Xenopus MCM genes was examined by RT-PCR using gene specific primers. (D) Expression of zebrafish MCM genes during early development. cDNA was prepared from developing embryos, and expression of MCM genes was examined by RT-PCR using gene-specific primers. (E and F) Expression of MCM genes examined by whole mount in situ hybridization. Embryos were fixed at the indicated time points and stained with labeled RNA probe. A sense strand probe was used as a negative control.
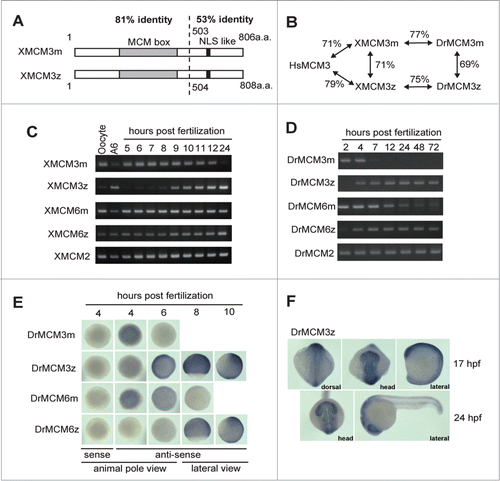
Figure 2. Nuclear transport activities of maternal and zygotic MCM3. (A) Comparison of nuclear localization signal-like sequences of various MCM3 proteins. Basic amino acids and acidic amino acids are shown in red and blue, respectively. Corresponding amino acid numbers are shown for Xenopus laevis and zebrafish proteins. (B) Nuclear transport activities of maternal and zygotic Xenopus MCM3. Recombinant GST-EGFP-MCM3 (either C-terminal region or only NLS-like sequence) fusion proteins were purified from E. coli. The recombinant proteins were added to Xenopus egg extracts after the formation of nuclei from added sperm chromatin, and the localization of the recombinant proteins was observed by fluorescent microscopy. Scale bar 20 μm. (C and E) Interaction of zebrafish importin α with DrMCM3s. An in vitro pull-down assay was performed using recombinant His-tagged zebrafish importin α and recombinant GST-EGFP-MCM3 (either C-terminal region fusion proteins [C] or full-length and maternal/zygotic chimera proteins [E]). GSH agarose-bound proteins were visualized by either anti-His or anti-GST antibodies. (D) Schematic diagram of maternal and zygotic proteins and their chimera proteins. Mz chimera 1, 2 and 3 consist of N-terminal maternal and C-terminal proteins, but transition points are different. Zygotic parts start at 659 a.a. (before NLS), 701 a.a. (after NLS) and 742 a.a. for mz1, mz2 and mz3, respectively.
![Figure 2. Nuclear transport activities of maternal and zygotic MCM3. (A) Comparison of nuclear localization signal-like sequences of various MCM3 proteins. Basic amino acids and acidic amino acids are shown in red and blue, respectively. Corresponding amino acid numbers are shown for Xenopus laevis and zebrafish proteins. (B) Nuclear transport activities of maternal and zygotic Xenopus MCM3. Recombinant GST-EGFP-MCM3 (either C-terminal region or only NLS-like sequence) fusion proteins were purified from E. coli. The recombinant proteins were added to Xenopus egg extracts after the formation of nuclei from added sperm chromatin, and the localization of the recombinant proteins was observed by fluorescent microscopy. Scale bar 20 μm. (C and E) Interaction of zebrafish importin α with DrMCM3s. An in vitro pull-down assay was performed using recombinant His-tagged zebrafish importin α and recombinant GST-EGFP-MCM3 (either C-terminal region fusion proteins [C] or full-length and maternal/zygotic chimera proteins [E]). GSH agarose-bound proteins were visualized by either anti-His or anti-GST antibodies. (D) Schematic diagram of maternal and zygotic proteins and their chimera proteins. Mz chimera 1, 2 and 3 consist of N-terminal maternal and C-terminal proteins, but transition points are different. Zygotic parts start at 659 a.a. (before NLS), 701 a.a. (after NLS) and 742 a.a. for mz1, mz2 and mz3, respectively.](/cms/asset/a84442a1-76c5-4730-8244-a32df729fe1c/kccy_a_954445_f0002_oc.gif)
Figure 3. Developmental defect observed after DrMCM3 mRNA injection. (A) Mid-gastrula embryos. Control (H1M-EGFP), DrMCM3m or DrMCM3z mRNA was microinjected into 2-cell embryos. Embryos were photographed at 8 hours after fertilization. Phenotype A shows a rough cell layer (arrow). Phenotype B shows ejected cells (arrowhead). Scale bar 150 μm. Embryos were categorized and the percentage showing phenotypes is shown. n means number of embryos counted. (B) Tail bud embryos. Control (H1M-EGFP), DrMCM3m or DrMCM3z mRNA was microinjected into 2-cell embryos. Embryos were photographed 10 hours after fertilization. Upper panels show the animal pole view, and lower panels show the lateral view. Phenotype C shows an uneven neural plate (black arrowheads), and phenotype D shows a defect in the extension of the body axis (head: arrow, tail: green arrowhead). Scale bar 150 μm. Embryos were categorized and the percentage showing these phenotypes is shown. (C) Compromised BrdU incorporation into nuclei caused by DrMCM3m mRNA injection. Control (H1M-EGFP), DrMCM3m or DrMCM3z mRNA was microinjected into 2-cell embryos. BrdU was injected at 7 hours after fertilization. Nine hours after fertilization, at the gastrula stage, embryos were fixed and stained with anti-BrdU antibodies. Nuclei that incorporated BrdU are shown as a brown signal. The percentage of embryos showing compromised BrdU incorporation is shown. Scale bar 150 μm.
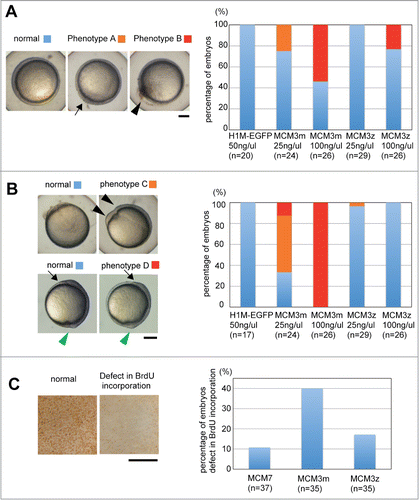
Figure 4. Developmental defect caused by DrMCM3 mRNA injection. (A) Representative phenotypes of pharyngula embryos caused by MCM3 mRNA injection. Phenotype 1: non-straight body axis (especially tail); phenotype 2: short body axis. Scale bar 300 μm. (B) Control (H1M-EGFP), DrMCM3m or DrMCM3z mRNA was microinjected into 2-cell embryos. At 24 hours after fertilization, embryos were categorized as in A, and the percentage of embryos showing phenotypes is shown. n means number of embryos. (C) Involvement of C-terminal regions of DrMCM3 in the developmental defect caused by overexpression. Experiments were performed as in B, using mRNA prepared from maternal and zygotic MCM3 and their chimeric genes as presented in Fig. 2D.
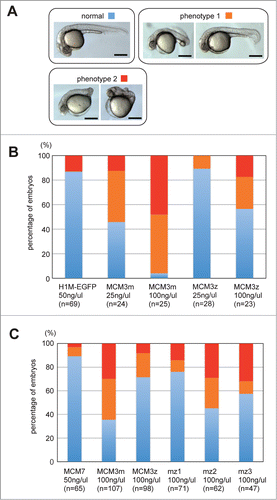
Table 1. Minimal DNA replication rate of various organisms. Minimal replication rates were obtained by dividing genome size by cell cycle length from 2-cell to 4-cell