Figures & data
Figure 1. Characterizing the CST overexpression cell line (CST-O/E). (A) Western blots with STN1 or TEN1 antibody showing levels of over-expression in CST-OE cells relative to Tet-On control. Amount of cell lysate (ng protein) is shown above each lane. *indicates cross-reacting band. (B) RT-qPCR of CTC1, STN1 and TEN1 mRNA levels. Levels are relative to control Tet-On cells with normalization to GAPDH (mean ± SEM, n = 3 experiments). (C) Western blot of FLAG-STN1 immunoprecipitate showing co-purification of HA-CTC1 and TEN1. (D) Analysis of DNA content by FACS shows normal cell cycle profile in CST, TEN1 and TEN1 + STN1 over-expressing cells. (E) Representative growth curves for the indicated cell lines (mean ± SEM, n = 3 experiments). Cells were counted in triplicate for each time point.
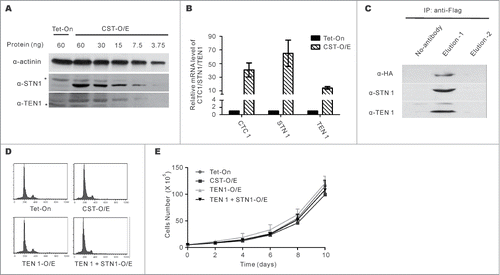
Figure 2. CST overexpression rescues the effects of replication stress. (A and B) Replication restart after release from HU. CST, TEN1, STN1 + TEN1 over-expressing cells were treated with HU for 2 h, released and then labeled with EdU for 30 min. (A) Images showing EdU uptake. Green, EdU; Blue, DAPI (B) Quantification of EdU uptake. Levels are relative to EdU incorporation by control Tet-On cells after release from HU (mean ± SEM, n = 3 experiments, p-values are indicated). (C-F) Cells were treated with 0.2 mM aphidicolin for 16 h (C and D) or 10 h (E and F) to induce formation of anaphase bridges and micronuclei. (C) Representative images of cells with (bottom) or without (top) anaphase bridges. (D) Quantification of the percentage of anaphase cells with bridges (mean ± SEM, n = 3 experiments, p-values are indicated). (E) Images of cells with (bottom) or without (top) micronuclei. The arrow points to a micronucleus. (F) Quantification of the percent of cells with micronuclei (mean ± SEM, n = 3 experiments, p-values are indicated).
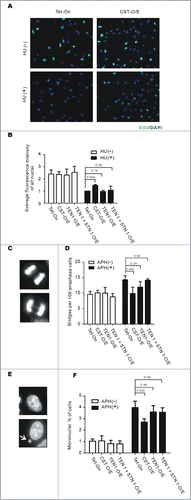
Figure 3. CST over-expression leads to an increase in new origin firing following release from HU-induced fork stalling. (A) Schematic showing the timing of HU treatment relative to IdU and CldU labeling. (B) Representative images of DNA fibers. Red, IdU; green, CldU. (C) Graph showing the percentage of the indicated types of track (Mean ± SD, n = 3 experiments, p-values are indicated). (D) Total number of tracks scored, number in brackets indicates the percentage of total tracks scored G, Green; R, Red.
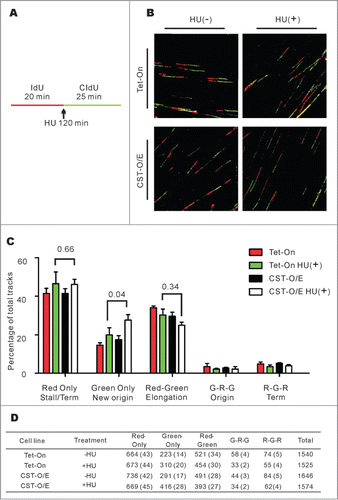
Figure 4. Alteration in CST abundance does not change cell cycle entry following HU treatment. (A) Schematic showing the experimental design. HeLa Tet-On or HeLa 1.2.11 cells were labeled with EdU, treated with HU for 2 h and then released for 0, 30 or 60 min. Cells not treated with HU were used as a control. EdU and PCNA were then detected to compare the fraction of cells entering S-phase (PCNA-only) relative to cells already in S-phase (PCNA+/EdU+) or just exiting (EdU+) S-phase. (B) Examples of flow cytometry data after 60 min release from HU treatment showing the percent of cells labeled with EdU and/or PCNA. Top: Control and CST overexpressing cell lines (HeLa Tet-On and CST-O/E); Bottom: STN1 depleted (shSTN1–7 clone) and control sh non-target (shNT) and shSTN1 rescue (shSTN1–7 Res) HeLa 1.2.11 cells. Quadrants were created using control cells without EdU or PCNA staining. (C) Graphical representation of the percent of cells entering S-phase (PCNA-only) (mean ± SEM, n ≥ 4 independent experiments).
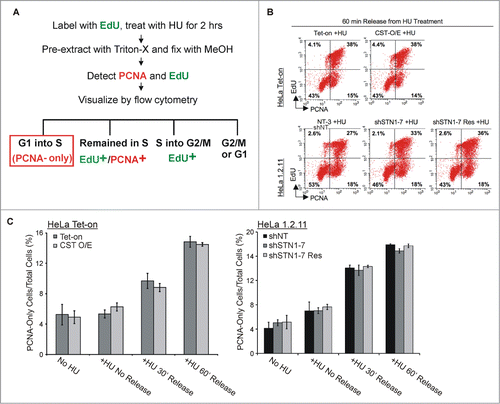
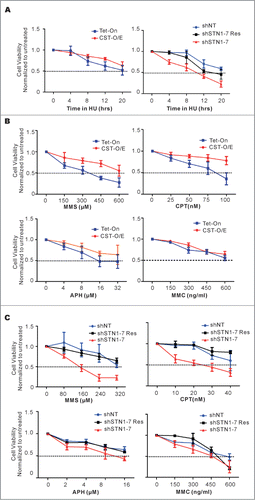
Figure 5. CST rescues cells from the cytotoxic effects of diverse DNA-damaging agents. (A) Cells were treated with 2 mM HU for the indicated times, released for 24 h and relative cell number determined by MTT assay. Left panel, results from CST-O/E and Tet-On control cells. Right panel, results from shSTN1 cells and shNT or shSTN1-Res control cells. (B and C) Cells were treated with the indicated concentrations of methyl methanesulfonate (MMS) for 8 h, camptothecin (CPT) for 16 h, aphidicolin (APH) for 8 h or mitomycin C (MMC) for 12 h, allowed to recover for 24 h and viability/proliferation measured by MTT assay. (B) Effect of drugs on over-expressing cells (CST-O/E) or control Tet-On cells. (C) Effect of drugs on shSTN1 or control shNT and shSTN1-Res cells. Each time point was assayed in triplicate and the data are shown as the mean ± S.D from 3 or 4 independent experiments. For each cell line, the value of the untreated sample was set at 1.