2,207
Views
27
CrossRef citations to date
0
Altmetric
REPORTS

Damage-induced BRCA1 phosphorylation by Chk2 contributes to the timing of end resection

, , , , , , , , & show all
Pages 437-448 | Received 18 Jul 2014, Accepted 30 Sep 2014, Published online: 06 Feb 2015

Figures & data

Figure 1. Primary Brca1S971A/S971A MEFs are more sensitive than Brca1+/+ MEFs to PARP inhibitor KU-0058948 in p53−/− background. Normal student t-test was used for statistical analysis. p = 0.02, 0.08 and 0.05 for PARPi at 0.1, 1 and 10μM, respectively. p = 0.0008 for overall curves(n = 3).
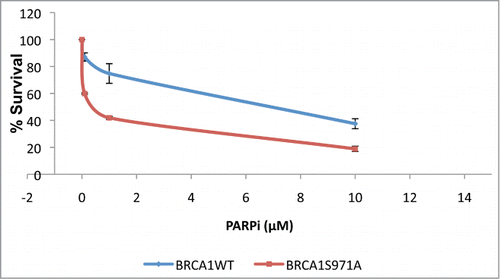
Figure 1. Primary Brca1S971A/S971A MEFs are more sensitive than Brca1+/+ MEFs to PARP inhibitor KU-0058948 in p53−/− background. Normal student t-test was used for statistical analysis. p = 0.02, 0.08 and 0.05 for PARPi at 0.1, 1 and 10μM, respectively. p = 0.0008 for overall curves(n = 3).

Figure 2. Abrogation of Chk2 phosphorylation on BRCA1 has no impact on the assembly of repair complexes upon DSBs. (A) Comparison of Mre11, CtIP, 53BP1 and Nbs1 recruitment at DSB laser stripes in Brca1+/+ and Brca1S971A/S971A MEFs. Left panels show laser stripes of Mre11, CtIP, 53BP1, Nbs1 (red) and γH2AX (green) at 10min point. Right panels show summary of 3 independent experiments for each individual protein. “+ve” stands for “positive.” For Mre11: 10 min (n = 352 total cells for wt, n = 340 total cells for S971A, p = 0.23); 30 min(n = 313 and 323, p = 0.50); 60 min (n = 315 and 308, p = 0.47). For Nbs1: 10 min (n = 297 and 265, p = 0.37), 30 min (n = 287 and 272, p = 0.62), 60 min (n = 251 and 258, p = 0.72). For 53BP1: 10 min (n = 452 and 535, p = 0.67); 30 min (n = 464 and 451, p = 0.16); 60 min (n = 490 and 462,p = 0.91). For CtIP: 10 min (n = 467 and 462, p = 0.53); 30 min (n = 429 and 534,p = 0.78); 60 min (n = 452 and 422, p = 0.84). Experiments conducted with overnight BrdU incorporation followed by microirradiation at 47% laser output. Similar results obtained from 55% laser output with no BrdU incorporation. Scale bar, 10μm. (B) Interaction between BRCA1 and CtIP, NBS1 or Rad51 is comparable for BRCA1(wt) and BRCA1(S988A) 30–60 min after IR in FLAG-BRCA1 coimmunoprecipitation.
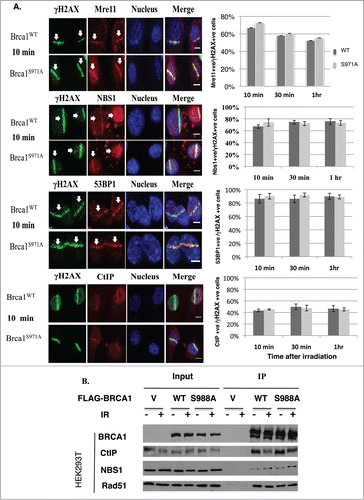
Figure 2. Abrogation of Chk2 phosphorylation on BRCA1 has no impact on the assembly of repair complexes upon DSBs. (A) Comparison of Mre11, CtIP, 53BP1 and Nbs1 recruitment at DSB laser stripes in Brca1+/+ and Brca1S971A/S971A MEFs. Left panels show laser stripes of Mre11, CtIP, 53BP1, Nbs1 (red) and γH2AX (green) at 10min point. Right panels show summary of 3 independent experiments for each individual protein. “+ve” stands for “positive.” For Mre11: 10 min (n = 352 total cells for wt, n = 340 total cells for S971A, p = 0.23); 30 min(n = 313 and 323, p = 0.50); 60 min (n = 315 and 308, p = 0.47). For Nbs1: 10 min (n = 297 and 265, p = 0.37), 30 min (n = 287 and 272, p = 0.62), 60 min (n = 251 and 258, p = 0.72). For 53BP1: 10 min (n = 452 and 535, p = 0.67); 30 min (n = 464 and 451, p = 0.16); 60 min (n = 490 and 462,p = 0.91). For CtIP: 10 min (n = 467 and 462, p = 0.53); 30 min (n = 429 and 534,p = 0.78); 60 min (n = 452 and 422, p = 0.84). Experiments conducted with overnight BrdU incorporation followed by microirradiation at 47% laser output. Similar results obtained from 55% laser output with no BrdU incorporation. Scale bar, 10μm. (B) Interaction between BRCA1 and CtIP, NBS1 or Rad51 is comparable for BRCA1(wt) and BRCA1(S988A) 30–60 min after IR in FLAG-BRCA1 coimmunoprecipitation.

Figure 3. Brca1S971A/S971A MEF has delayed end-resection in response to DSBs. (A) Rad51 laser stripes (red) and γH2AX (green) from S/G2 cells at 10 min, 30 min and 60 min time points. Scale bar, 10μm. (B) Average from 6 independent experiments (3 experiments from each pair of MEFs). Ten min (n = 338and303, p = 2.87E-05); 30 min (n = 377and383, p = 0.26); 60 min (n = 426and330, p = 0.45). (C) Representative BrdU (ssDNA) stripes (red) and γH2AX (green) from total cell population at 10, 30 and 60 min time points. 55% laser output and 2 hrs of BrdU incorporation. (D) Average from 6 independent experiments (3 experiments/pair of MEFs). Ten min (n = 740and640, p = 0.000584); 30 min (n = 710and617, p = 2.65E-05); 60 min (n = 682and605, p = 0.069). (E) Quantification of BrdU stripe intensity from one representative experiment. Intensities are displayed with arbitrary units defined by Image J software.
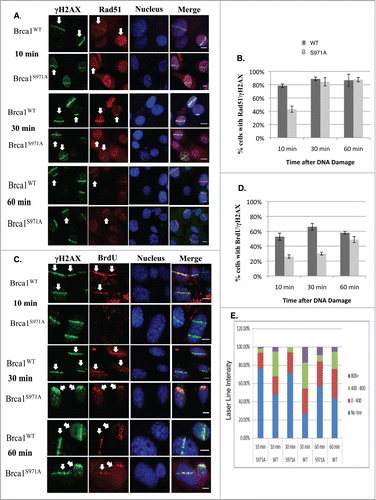
Figure 3. Brca1S971A/S971A MEF has delayed end-resection in response to DSBs. (A) Rad51 laser stripes (red) and γH2AX (green) from S/G2 cells at 10 min, 30 min and 60 min time points. Scale bar, 10μm. (B) Average from 6 independent experiments (3 experiments from each pair of MEFs). Ten min (n = 338and303, p = 2.87E-05); 30 min (n = 377and383, p = 0.26); 60 min (n = 426and330, p = 0.45). (C) Representative BrdU (ssDNA) stripes (red) and γH2AX (green) from total cell population at 10, 30 and 60 min time points. 55% laser output and 2 hrs of BrdU incorporation. (D) Average from 6 independent experiments (3 experiments/pair of MEFs). Ten min (n = 740and640, p = 0.000584); 30 min (n = 710and617, p = 2.65E-05); 60 min (n = 682and605, p = 0.069). (E) Quantification of BrdU stripe intensity from one representative experiment. Intensities are displayed with arbitrary units defined by Image J software.

Figure 4. (A) Activation of phospho-Chk1 and phospho-RPA, not phosphorylation of ATM, Chk2 and H2AX, is impaired in Brca1S971A/S971A MEFs 10 min after γIR (10 Gy). (B) The cell cycle distribution of Brca1+/+ and Brca1S971A/S971A MEFs using FACS analysis. Left panel: MEFs are cultured in the presence of BrdU for 2 hours and BrdU positive/S phase cells are identified by a BrdU antibody. Right panel: M-phase population in normal growing MEFs is detected by a phospho-histone H3Ser10 antibody. One representative experiment from 3 independent experiments.
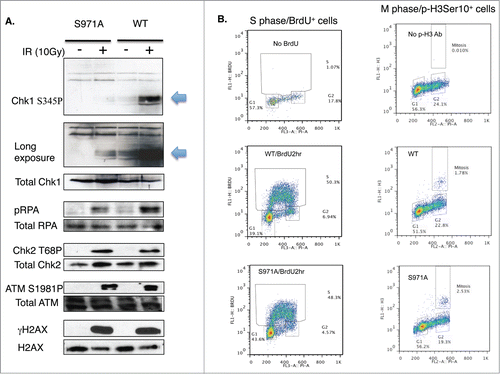
Figure 4. (A) Activation of phospho-Chk1 and phospho-RPA, not phosphorylation of ATM, Chk2 and H2AX, is impaired in Brca1S971A/S971A MEFs 10 min after γIR (10 Gy). (B) The cell cycle distribution of Brca1+/+ and Brca1S971A/S971A MEFs using FACS analysis. Left panel: MEFs are cultured in the presence of BrdU for 2 hours and BrdU positive/S phase cells are identified by a BrdU antibody. Right panel: M-phase population in normal growing MEFs is detected by a phospho-histone H3Ser10 antibody. One representative experiment from 3 independent experiments.

Figure 5. Retention/Slower dispersion of Brca1(S971A) at DSBs. (A) Brca1 (red) stripes at 10, 30, and 60 min time points after microirradiation. 47% laser output and 2 hrs of BrdU incorporation. Scale bar, 10 μm. (B) The average intensity of Brca1 stripes over a 60 min time course. Quantification of each Brca1 stripe with arbitrary units defined by Image J software and shown in a dot plot.
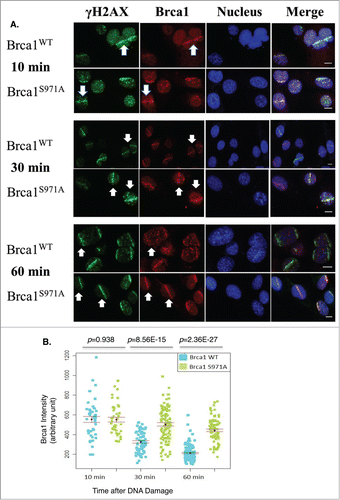
Figure 5. Retention/Slower dispersion of Brca1(S971A) at DSBs. (A) Brca1 (red) stripes at 10, 30, and 60 min time points after microirradiation. 47% laser output and 2 hrs of BrdU incorporation. Scale bar, 10 μm. (B) The average intensity of Brca1 stripes over a 60 min time course. Quantification of each Brca1 stripe with arbitrary units defined by Image J software and shown in a dot plot.

Figure 6. The impact of Chk2 phosphorylation on BRCA1 stability and ubiquitination. (A) Comparison of phosphorylated Brca1 level in Brca1+/+ and Brca1S971A/S971A MEFs upon γIR (10 Gy). One representative experiment from 4 independent experiments. Brca1 is detected by an antibody recognizing mouse Brca1 (a gift of Richard Baer). (B) Quantification of phospho-Brca1 levels normalized by tubulin levels. Average of 4 independent experiments. Trend line represents polynomial fit of data. P = 0.001 using pairwise t-test. (C) Comparison of in vivo ubiquitination of FLAG-tagged BRCA1(wt) and BRCA1(S988A).
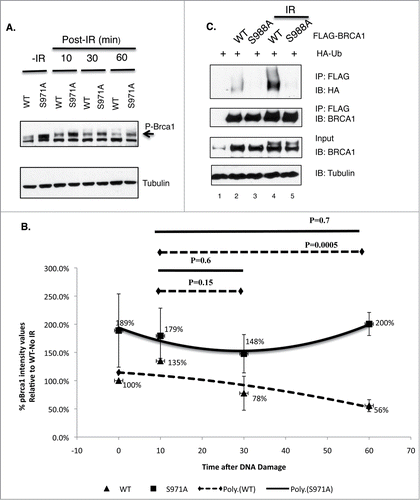
Figure 6. The impact of Chk2 phosphorylation on BRCA1 stability and ubiquitination. (A) Comparison of phosphorylated Brca1 level in Brca1+/+ and Brca1S971A/S971A MEFs upon γIR (10 Gy). One representative experiment from 4 independent experiments. Brca1 is detected by an antibody recognizing mouse Brca1 (a gift of Richard Baer). (B) Quantification of phospho-Brca1 levels normalized by tubulin levels. Average of 4 independent experiments. Trend line represents polynomial fit of data. P = 0.001 using pairwise t-test. (C) Comparison of in vivo ubiquitination of FLAG-tagged BRCA1(wt) and BRCA1(S988A).

Figure 7. (A) BRCA1 is ubiquitinated in vitro by SCFSkp2. FLAG-BRCA1 immunoprecipitated from HEK293T is used as the substrate. Myc-tagged Skp1, Cul1 and Roc1 are coexpressed in HEK293T in the presence of FLAG-tagged F-box proteins and coimmunoprecipitated with FLAG-FBX proteins as the source of SCF E3 complex. (B) Endogenous Skp1 and Skp2 (red) are localized at DSBs in asynchronously growing U2OS cells. 55% laser output and no BrdU incorporation. Scale bar, 10μm. (C) Knockdown of Skp2 impairs BRCA1 ubiquitination in a HEK293T cell line that stably expresses FLAG-BRCA1, as described in.Citation51 FLAG-BRCA1 is immunoprecipitated by a FLAG antibody. (D) A Skp2 inhibitor (Skp2-C25) impairs end resection in Brca1+/+ MEFs upon microirradiation. Skp2-C25 is added at a final concentration of 10 μM and 15 min before microirradiation. Average from 3 independent experiments. For Rad51: 10 min (n = 133 for no inhibitor, n = 179 for with inhibitor, p = 0.0267); 30 min (n = 159and219, p = 0.0086); 60 min (n = 157 and 209, p = 0.0169). For BrdU: 10 min (n = 241 for no inhibitor, n = 206 for with inhibitor, p = 0.049); 30 min (n = 276 and 302, p = 6.8E-05); 60 min (n = 269and246, p = 0.034).
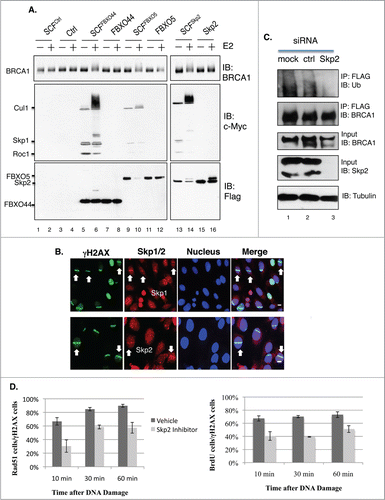
Figure 7. (A) BRCA1 is ubiquitinated in vitro by SCFSkp2. FLAG-BRCA1 immunoprecipitated from HEK293T is used as the substrate. Myc-tagged Skp1, Cul1 and Roc1 are coexpressed in HEK293T in the presence of FLAG-tagged F-box proteins and coimmunoprecipitated with FLAG-FBX proteins as the source of SCF E3 complex. (B) Endogenous Skp1 and Skp2 (red) are localized at DSBs in asynchronously growing U2OS cells. 55% laser output and no BrdU incorporation. Scale bar, 10μm. (C) Knockdown of Skp2 impairs BRCA1 ubiquitination in a HEK293T cell line that stably expresses FLAG-BRCA1, as described in.Citation51 FLAG-BRCA1 is immunoprecipitated by a FLAG antibody. (D) A Skp2 inhibitor (Skp2-C25) impairs end resection in Brca1+/+ MEFs upon microirradiation. Skp2-C25 is added at a final concentration of 10 μM and 15 min before microirradiation. Average from 3 independent experiments. For Rad51: 10 min (n = 133 for no inhibitor, n = 179 for with inhibitor, p = 0.0267); 30 min (n = 159and219, p = 0.0086); 60 min (n = 157 and 209, p = 0.0169). For BrdU: 10 min (n = 241 for no inhibitor, n = 206 for with inhibitor, p = 0.049); 30 min (n = 276 and 302, p = 6.8E-05); 60 min (n = 269and246, p = 0.034).
Supplemental material

972901_Supplementary_Materials.zip

Download Zip (4.7 MB)

Reprints and Corporate Permissions

Please note: Selecting permissions does not provide access to the full text of the article, please see our help page How do I view content?

To request a reprint or corporate permissions for this article, please click on the relevant link below:

Academic Permissions

Please note: Selecting permissions does not provide access to the full text of the article, please see our help page How do I view content?

Obtain permissions instantly via Rightslink by clicking on the button below:

If you are unable to obtain permissions via Rightslink, please complete and submit this Permissions form. For more information, please visit our Permissions help page.