1,943
Views
61
CrossRef citations to date
0
Altmetric
REPORTS

miR-146a is directly regulated by STAT3 in human hepatocellular carcinoma cells and involved in anti-tumor immune suppression

, , , , &
Pages 243-252 | Received 16 Jul 2014, Accepted 12 Oct 2014, Published online: 21 Jan 2015

Figures & data

Figure 1. The expression level of miR-146a in human HCC cells was inhibited by blocking STAT3. After transfecting STAT3 decoy ODN (Decoy), scramble ODN (Scramble), or Lipofectamine reagent control (Ctrl) into HepG2 (A) and PLC/PRF/5 (B) cells for 24 h, miR-146a expression was measured by qPCR analysis. (C) Luciferase activity of pmiR-Reporter vector containing the mRNA 3′-UTR miR-146a target genes STAT1 and TRAF6 was detected using a dual-GloTM Luciferase assay system. (D) Levels of ISG15, MxA, and OAS-1 mRNA were analyzed by qPCR analysis. Data are representative of 3 independent experiments, and statistical significance was determined as **P < 0.01 and *P < 0.05 compared to Lipo-Ctrl.
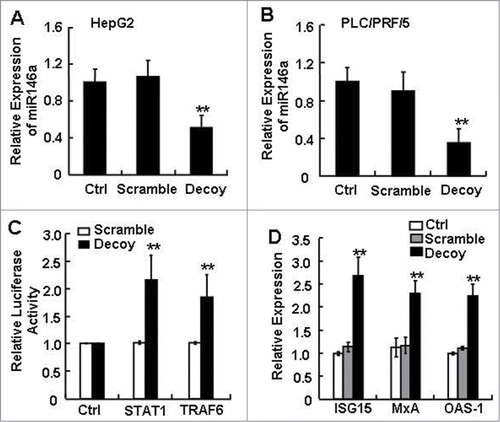
Figure 1. The expression level of miR-146a in human HCC cells was inhibited by blocking STAT3. After transfecting STAT3 decoy ODN (Decoy), scramble ODN (Scramble), or Lipofectamine reagent control (Ctrl) into HepG2 (A) and PLC/PRF/5 (B) cells for 24 h, miR-146a expression was measured by qPCR analysis. (C) Luciferase activity of pmiR-Reporter vector containing the mRNA 3′-UTR miR-146a target genes STAT1 and TRAF6 was detected using a dual-GloTM Luciferase assay system. (D) Levels of ISG15, MxA, and OAS-1 mRNA were analyzed by qPCR analysis. Data are representative of 3 independent experiments, and statistical significance was determined as **P < 0.01 and *P < 0.05 compared to Lipo-Ctrl.

Figure 2. miR-146a promoted the expression of inflammatory cytokines associated with STAT3 activation in HCC cells. As described in the Materials and Methods section, HepG2 cells were transfected with negative control RNA (NC), miR-146a mimics (miR146a-Mim), miR-146a inhibitors (miR146a-Inh), or STAT3 decoy ODN (STAT3-Dec). (A) HepG2 proliferation was analyzed by MTT assay at the indicated time points. (B) Cell cycle was determined by flow cytometry. The levels of inflammatory cytokines associated with STAT3 activation were determined by qPCR (C) and ELISA (D) analysis. Data are representative of 3 independent experiments, and statistical significance was determined as **P < 0.01 and *P < 0.05 compared to NC.
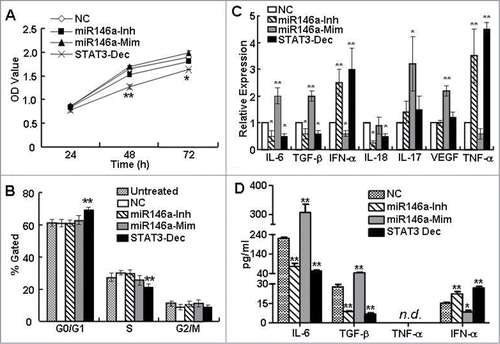
Figure 2. miR-146a promoted the expression of inflammatory cytokines associated with STAT3 activation in HCC cells. As described in the Materials and Methods section, HepG2 cells were transfected with negative control RNA (NC), miR-146a mimics (miR146a-Mim), miR-146a inhibitors (miR146a-Inh), or STAT3 decoy ODN (STAT3-Dec). (A) HepG2 proliferation was analyzed by MTT assay at the indicated time points. (B) Cell cycle was determined by flow cytometry. The levels of inflammatory cytokines associated with STAT3 activation were determined by qPCR (C) and ELISA (D) analysis. Data are representative of 3 independent experiments, and statistical significance was determined as **P < 0.01 and *P < 0.05 compared to NC.

Figure 3. STAT3 directly regulated miR-146a expression in HCC. (A) A ChIP assay was performed 24 h after STAT3 decoy ODN (Dec) or scramble ODN (Scr) treatment to evaluate the recruitment of STAT3 on miR-146a promoter (miR146a-pro). (B) The level of phosphorylated STAT3 (p-STAT3) (Tyr705) in IL-6–stimulated (400 U/mL) HepG2 cells was examined by western blotting (upper), and a qPCR assay was used to detect the expression of miR-146a in HepG2 cells (lower). (C) After IL-6 stimulation, a ChIP-PCR assay was performed using an anti–p-STAT3705 antibody or rabbit IgG as a control. (D) The luciferase activity of the miR-146a promoter (miR146a-pro) in HepG2 cells was measured using a dual-GloTM Luciferase assay system. The ratio of firefly to Renilla luciferase activity with pGL3-TK-Luciferase transfection was set as 1. Data are representative of 3 independent experiments, and statistical significance was determined as **P < 0.01 and *P < 0.05 compared to control.
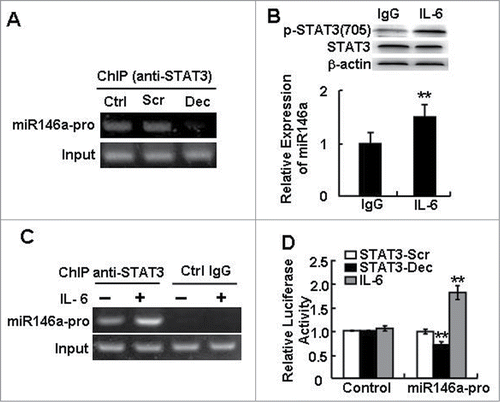
Figure 3. STAT3 directly regulated miR-146a expression in HCC. (A) A ChIP assay was performed 24 h after STAT3 decoy ODN (Dec) or scramble ODN (Scr) treatment to evaluate the recruitment of STAT3 on miR-146a promoter (miR146a-pro). (B) The level of phosphorylated STAT3 (p-STAT3) (Tyr705) in IL-6–stimulated (400 U/mL) HepG2 cells was examined by western blotting (upper), and a qPCR assay was used to detect the expression of miR-146a in HepG2 cells (lower). (C) After IL-6 stimulation, a ChIP-PCR assay was performed using an anti–p-STAT3705 antibody or rabbit IgG as a control. (D) The luciferase activity of the miR-146a promoter (miR146a-pro) in HepG2 cells was measured using a dual-GloTM Luciferase assay system. The ratio of firefly to Renilla luciferase activity with pGL3-TK-Luciferase transfection was set as 1. Data are representative of 3 independent experiments, and statistical significance was determined as **P < 0.01 and *P < 0.05 compared to control.

Figure 4. miR-146a contributed to human HCC–induced immune suppression in vitro. After HepG2 cells were transfected with negative control RNA (NC), miR-146a mimics (miR146a-Mim), miR-146a inhibitors (miR146a-Inh), or STAT3 decoy ODN (STAT3-Dec) as described in the Materials and Methods section, supernatant was collected and incubated with NK-92 or NKL cells in an in vitro culture for 12 h. (A) The inhibitory effect of these NK cells on the viability of naïve HepG2 cells was then analyzed by an MTT assay at an E:T ratio of 5:1. (B) The specific lysis of HepG2 cells by these NK-92 cells was detected using a 4-h CFSE/7-AAD flow cytometry assay at an E:T ratio of 5:1. (C) The molecules associated with NK cell cytolysis were examined by flow cytometry. The data in the histograms represent the statistical analysis of the percentage of positive cells. Medium, NK cells cultured in α-MEM alone without any supernatant from HCC cells. Data are representative of 3 independent experiments, and statistical significance was determined as **P < 0.01 and *P < 0.05 compared to NC.
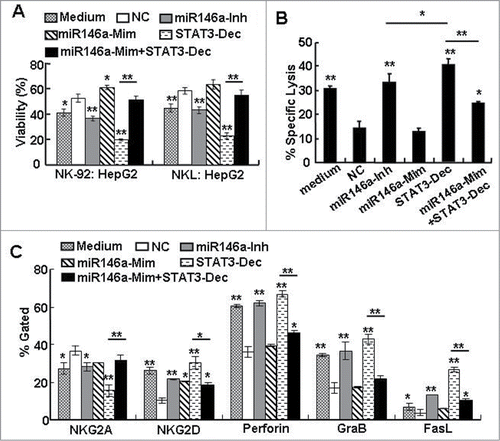
Figure 4. miR-146a contributed to human HCC–induced immune suppression in vitro. After HepG2 cells were transfected with negative control RNA (NC), miR-146a mimics (miR146a-Mim), miR-146a inhibitors (miR146a-Inh), or STAT3 decoy ODN (STAT3-Dec) as described in the Materials and Methods section, supernatant was collected and incubated with NK-92 or NKL cells in an in vitro culture for 12 h. (A) The inhibitory effect of these NK cells on the viability of naïve HepG2 cells was then analyzed by an MTT assay at an E:T ratio of 5:1. (B) The specific lysis of HepG2 cells by these NK-92 cells was detected using a 4-h CFSE/7-AAD flow cytometry assay at an E:T ratio of 5:1. (C) The molecules associated with NK cell cytolysis were examined by flow cytometry. The data in the histograms represent the statistical analysis of the percentage of positive cells. Medium, NK cells cultured in α-MEM alone without any supernatant from HCC cells. Data are representative of 3 independent experiments, and statistical significance was determined as **P < 0.01 and *P < 0.05 compared to NC.

Figure 5. Inhibition of miR-146a promoted the anti-tumor immune response in vivo. (A) After transfecting STAT3 decoy ODN (Dec), scramble ODN (Scr), or Lipofectamine reagent control (Ctrl) into the murine liver cancer cell line Hepa 1–6 for 24 h, miR-146a expression was measured by qPCR analysis. (B–E) Hepa 1–6 cells transfected with miR-146a inhibitors (miR146a-Inh) or control RNA (NC) were injected s.c. into the right posterior flank of C57BL/6 mice (2 × 10⁶ cells/mouse), and tumor-bearing mice were sacrificed after 2 weeks. (B) The inhibitory effect of freshly isolated lymphocytes from liver or spleen on the viability of naïve Hepa 1–6 cells was analyzed by MTT assay at an E:T ratio of 50:1. (C) The weight of tumor, spleen, and liver in the indicated tumor-bearing groups was measured. (D) Flow cytometry analysis was performed to examine CD69, CD25, NKG2D, and FasL levels in CD3NK1.1+ and CD3+NK1.1 lymphocytes from tumor tissue, spleen, liver, and axillary and inguinal LNs. (E) TGF-β, IL-6, IL-18, TNF-α, and IFN-γ levels in serum were detected by ELISA assay. Data are representative of 3 independent experiments, and statistical significance was determined as **P < 0.01 and *P < 0.05 compared to control.
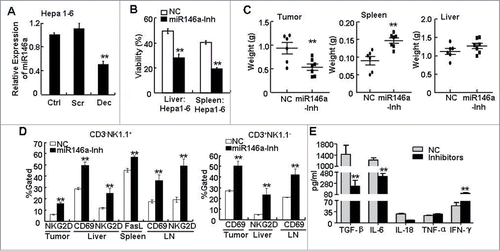
Figure 5. Inhibition of miR-146a promoted the anti-tumor immune response in vivo. (A) After transfecting STAT3 decoy ODN (Dec), scramble ODN (Scr), or Lipofectamine reagent control (Ctrl) into the murine liver cancer cell line Hepa 1–6 for 24 h, miR-146a expression was measured by qPCR analysis. (B–E) Hepa 1–6 cells transfected with miR-146a inhibitors (miR146a-Inh) or control RNA (NC) were injected s.c. into the right posterior flank of C57BL/6 mice (2 × 10⁶ cells/mouse), and tumor-bearing mice were sacrificed after 2 weeks. (B) The inhibitory effect of freshly isolated lymphocytes from liver or spleen on the viability of naïve Hepa 1–6 cells was analyzed by MTT assay at an E:T ratio of 50:1. (C) The weight of tumor, spleen, and liver in the indicated tumor-bearing groups was measured. (D) Flow cytometry analysis was performed to examine CD69, CD25, NKG2D, and FasL levels in CD3−NK1.1+ and CD3+NK1.1− lymphocytes from tumor tissue, spleen, liver, and axillary and inguinal LNs. (E) TGF-β, IL-6, IL-18, TNF-α, and IFN-γ levels in serum were detected by ELISA assay. Data are representative of 3 independent experiments, and statistical significance was determined as **P < 0.01 and *P < 0.05 compared to control.
Supplemental material

977112_Supplementary_Materials.zip

Download Zip (4.8 KB)

Reprints and Corporate Permissions

Please note: Selecting permissions does not provide access to the full text of the article, please see our help page How do I view content?

To request a reprint or corporate permissions for this article, please click on the relevant link below:

Academic Permissions

Please note: Selecting permissions does not provide access to the full text of the article, please see our help page How do I view content?

Obtain permissions instantly via Rightslink by clicking on the button below:

If you are unable to obtain permissions via Rightslink, please complete and submit this Permissions form. For more information, please visit our Permissions help page.