1,164
Views
14
CrossRef citations to date
0
Altmetric
REPORTS

The Functional Repertoire of Survivin's Tails

Pages 261-268 | Received 17 Oct 2014, Accepted 20 Oct 2014, Published online: 21 Jan 2015

Figures & data

Figure 1. Expression of survivin truncations and their ability to protect cells from death threats. (A and B) 3D models of the crystal structure of (A) the survivin homodimer (1F3H), and (B) survivin bound to the NH2 terminus of borealin (2RAW). Models were created using UCSF Chimera Modeling software Citation29. (A) Survivin monomers are shown in light and dark gray. The terminal 22 amino acids removed in survivin1–120 are indicated in red, the NH2 terminus of survivin is shown in green. Note that only amino acids 6–10 are highlighted as residues 1–5 remain unresolved. (B) The NH2 terminus of borealin is indicated in blue. (C) An immunoblot showing expression of the ectopic forms of survivin in each stable line; tubulin indicates loading. (D) Fluorescence imaging reveals that all forms examined are predominantly cytoplasmic. Scale bar 5 μm. (E) Caspase activity assay in response to TRAIL treatment over 90 minutes expressed in relative fluorescence units (RFU). Error bars indicate standard deviation from the mean. (F) Clonogenic survival in response to X-irradiation plotted on a logarithmic scale. Experiments were performed in triplicate, 3 independent times.
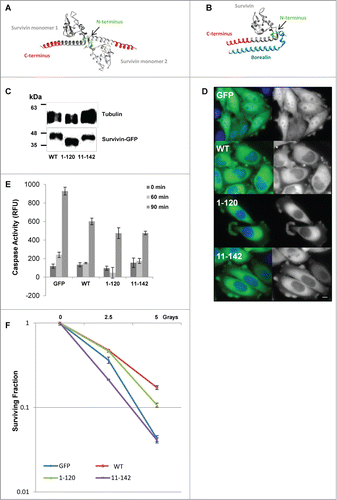
Figure 1. Expression of survivin truncations and their ability to protect cells from death threats. (A and B) 3D models of the crystal structure of (A) the survivin homodimer (1F3H), and (B) survivin bound to the NH2 terminus of borealin (2RAW). Models were created using UCSF Chimera Modeling software Citation29. (A) Survivin monomers are shown in light and dark gray. The terminal 22 amino acids removed in survivin1–120 are indicated in red, the NH2 terminus of survivin is shown in green. Note that only amino acids 6–10 are highlighted as residues 1–5 remain unresolved. (B) The NH2 terminus of borealin is indicated in blue. (C) An immunoblot showing expression of the ectopic forms of survivin in each stable line; tubulin indicates loading. (D) Fluorescence imaging reveals that all forms examined are predominantly cytoplasmic. Scale bar 5 μm. (E) Caspase activity assay in response to TRAIL treatment over 90 minutes expressed in relative fluorescence units (RFU). Error bars indicate standard deviation from the mean. (F) Clonogenic survival in response to X-irradiation plotted on a logarithmic scale. Experiments were performed in triplicate, 3 independent times.

Figure 2. Survivin truncations mislocalise during mitosis. (A–C) Exponentially growing HeLa cells expressing (A) survivin-GFP (WT); (B) survivin1–120-GFP and (C) survivin 11–142-GFP as indicated, were stained with NucBlue and imaged live. (D) Anaphase cells were fixed with formaldehyde and immunoprobed with anti-tubulin antibodies to show the integrity of the central spindle in the different lines. Scale bars 5 μm. (E) Analysis of mitotic stages of cells 120 minutes post-release from DMA-induced mitotic arrest.
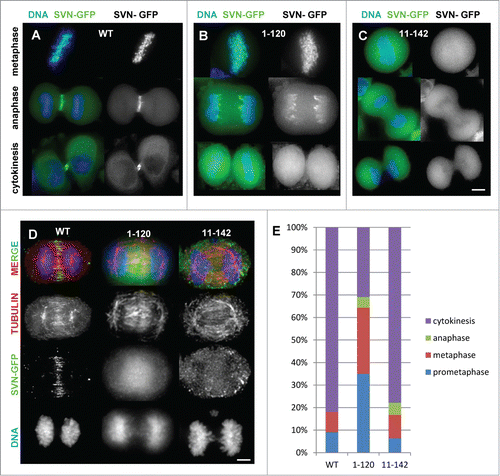
Figure 2. Survivin truncations mislocalise during mitosis. (A–C) Exponentially growing HeLa cells expressing (A) survivin-GFP (WT); (B) survivin1–120-GFP and (C) survivin 11–142-GFP as indicated, were stained with NucBlue and imaged live. (D) Anaphase cells were fixed with formaldehyde and immunoprobed with anti-tubulin antibodies to show the integrity of the central spindle in the different lines. Scale bars 5 μm. (E) Analysis of mitotic stages of cells 120 minutes post-release from DMA-induced mitotic arrest.

Figure 3. Mitotic competency of survivin truncations. Endogenous survivin was removed by siRNA from cells expressing survivin1–120-GFP (A) or survivin 11–142-GFP. (B) 72 h later cells were fixed and immunoprobed with anti-tubulin antibodies (red) and counterstained with DAPI (blue). Scale bars 5 μm. (C) Immunoblotting with anti-survivin antibodies confirming removal of the endogenous protein, and resistance of the ectopic form. Tubulin is shown to indicate equality in loading. C = control, S = survivin specific siRNA. (D) Cell proliferation over 72h was assessed using a metabolic (resazurin) assay. Average and standard deviation of cell number is plotted on the Y-axis. (E) Analysis of cell condition 72h post-siRNA treatment in each population, viewed in real time by fluorescence imaging using GFP and NucBlu signals.
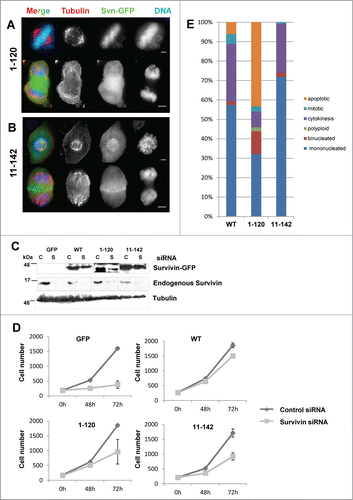
Figure 3. Mitotic competency of survivin truncations. Endogenous survivin was removed by siRNA from cells expressing survivin1–120-GFP (A) or survivin 11–142-GFP. (B) 72 h later cells were fixed and immunoprobed with anti-tubulin antibodies (red) and counterstained with DAPI (blue). Scale bars 5 μm. (C) Immunoblotting with anti-survivin antibodies confirming removal of the endogenous protein, and resistance of the ectopic form. Tubulin is shown to indicate equality in loading. C = control, S = survivin specific siRNA. (D) Cell proliferation over 72h was assessed using a metabolic (resazurin) assay. Average and standard deviation of cell number is plotted on the Y-axis. (E) Analysis of cell condition 72h post-siRNA treatment in each population, viewed in real time by fluorescence imaging using GFP and NucBlu signals.

Figure 4. C-terminal truncation inhibits borealin interaction and inhibits mitosis. (A) To determine viability over a longer period, cells treated for 72 h with siRNA were re-seeded at low density and the resultant clonal morphologies assessed 7 d later. Scale bar 50 μm. The number of colonies that formed as expressed in the top left corner as a percentage of colonies on control siRNA treated plates. (B) Quantitation of the percentage of cells that are mononucleated, binucleated, apoptotic or mitotic within individual colonies. (C) Average number of cells in each colony and the standard deviation from the mean. (D) Immunoprecipitation using anti-GFP antibodies and immunoblot analysis to assess interaction with endogenous borealin. Equality of borealin expression is indicated in lower panel which is an immunoblot of whole cell extracts. (E) Immunofluorescence of fixed cells in prometaphase or anaphase, probed with anti-borealin antibodies, and visualised with Cy5 anti-rabbit secondary antibodies. Bar, 5 μm.
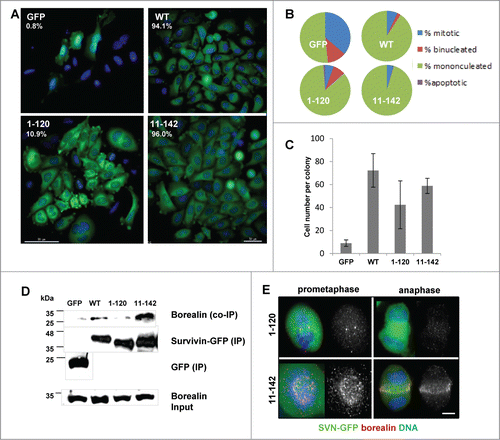
Figure 4. C-terminal truncation inhibits borealin interaction and inhibits mitosis. (A) To determine viability over a longer period, cells treated for 72 h with siRNA were re-seeded at low density and the resultant clonal morphologies assessed 7 d later. Scale bar 50 μm. The number of colonies that formed as expressed in the top left corner as a percentage of colonies on control siRNA treated plates. (B) Quantitation of the percentage of cells that are mononucleated, binucleated, apoptotic or mitotic within individual colonies. (C) Average number of cells in each colony and the standard deviation from the mean. (D) Immunoprecipitation using anti-GFP antibodies and immunoblot analysis to assess interaction with endogenous borealin. Equality of borealin expression is indicated in lower panel which is an immunoblot of whole cell extracts. (E) Immunofluorescence of fixed cells in prometaphase or anaphase, probed with anti-borealin antibodies, and visualised with Cy5 anti-rabbit secondary antibodies. Bar, 5 μm.