Figures & data
Table 1. Analysis of VA tumor cohort
Figure 1. Inactivation of Atm in HSCs Impairs αβ (T)Cell Development. (A) Representative flow cytometry analysis of CD4 and CD8 expression in thymocytes isolated from WT, Atm−/−, and VA mice. The frequencies of cells in the DN, DP, CD4+ SP, and CD8+ SP gates are indicated. (B) Graph showing the average numbers of total thymocytes from WT (n = 8), Atm−/− (n = 4), and VA (n = 10) mice. Error bars are SD. (C) Graph showing the average numbers of DN, DP, CD4+ SP, and CD8+ SP total thymocytes from WT (n = 8), Atm−/− (n = 4), and VA (n = 4) mice. Error bars are SD. These experiments were each independently performed more than 3 times.
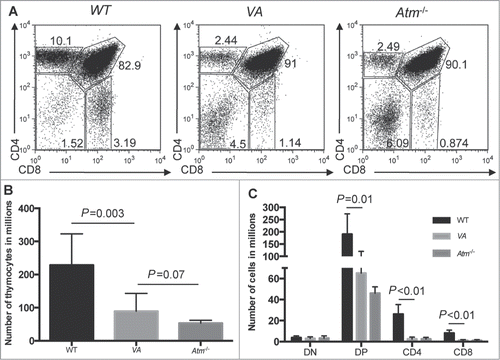
Figure 2. Somatic Inactivation of Atm in HSCs Predisposes Mice to T-ALLs with Oncogenic Translocations. (A) Kaplain-Meier curve depicting the cancer-free survival of 27 cohort VA mice. All cohort mice succumbed to thymic malignancies except for 2 mice that succumbed to cancers in peripheral lymphoid tissues (indicated by asterisks). (B and C) Flow cytometry analysis of VA cancers no. 408 (B) or 656 (C) showing surface expression of TCRβ or CD4 and CD8. Gates were drawn using appropriate non-malignant cells. Shown are the percentages of cells in each gate. (D) Top, schematic of the Tcrβ locus showing locations of the indicated Tcrβ segments, HindIII restriction sites (H3), and 3’Jβ1 and 3’Jβ2 probes. Bottom, Southern blots of HindIII-digested DNA from the indicated VA thymic cancers (and VA splenic cancer 480) or from the kidney of a WT mouse using the 3’Jβ1 or 3’Jβ2 probe. Germline (GL) bands are indicated. The membrane was hybridized with the 3’Jβ1 probe and then stripped and hybridized with the 3’Jβ2 probe, revealing which VA cancers lack 3’Jβ1-hybridizing band(s) due to Vβ-to-Dβ2-Jβ2 rearrangements on both alleles. (E) SKY analysis of a metaphase from VA T-ALLs no. 281 with the clonal translocations indicated. (F) Top, schematic of the Tcrα locus showing locations of indicated Tcrα segments, HindIII restriction sites (H3), and 5’Jα probe. Bottom, Southern blot of HindIII-digested DNA from the indicated VA thymic cancers (and VA splenic cancer 480) or kidney of a WT mouse using the 5’Jα probe. The germline band is indicated. The membrane from D was stripped of the 3’Jβ2 probe and then probed with the 5’Jα probe, revealing which VA cancers lacked 5’Jα-hybridizing band(s) due to Vα-to-Jα rearrangements on both alleles.
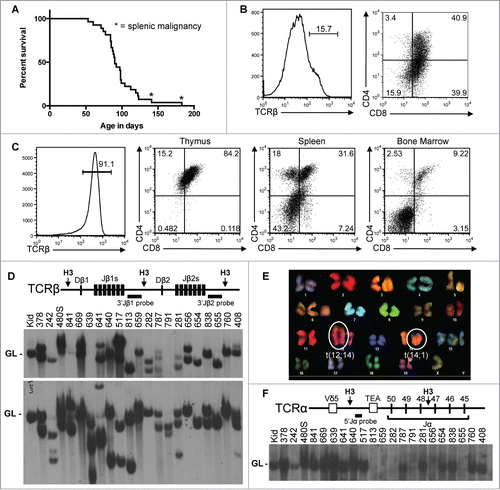
Table 2. VA SKY summary
Figure 3. Atm and Tp53 Cooperate to Suppress T-ALL. (A) Kaplan-Meier curves depicting the cancer-free survival of 28 cohort VAp mice and the 27 cohort VA mice from . All VAp mice succumbed to thymic cancers. (B) Flow cytometry analysis of VAp T-ALL no. 621 showing expression of TCRβ or CD4 and CD8. Gates were drawn using appropriate non-malignant cells. Shown are the percentages of cells in each gate. (C) Top, schematic of the Tcrβ locus showing locations of indicated Tcrβ segments, HindIII restriction sites (H3), and 3’Jβ1 and 3’Jβ2 probes. Bottom, Southern blots of HindIII-digested DNA from the indicated VAp T-ALLs or the kidney of a WT mouse with the 3’Jβ1 or 3’Jβ2 probe. Germline (GL) bands are indicated. The membrane was first hybridized with the 3’Jβ1 probe and then stripped and hybridized with the 3’Jβ2 probe, revealing which VAp cancers lack 3’Jβ1-hybridizing band(s) due to Vβ-to-Dβ2-Jβ2 rearrangements on both alleles. (D) SKY analysis of a metaphase from VAp T-ALL no. 562 with clonal translocations indicated. (E) Top, schematic of the Tcrα locus showing locations of indicated Tcrα segments, HindIII restriction sites (H3), and 5’Jα probe. Bottom, Southern blot of HindIII-digested DNA from the indicated VAp thymic cancers or the kidney of a WT mouse using the 5’Jα probe. The germline (GL) band is indicated. The membrane from C was stripped of the 3’Jβ2 probe and then probed with the 5’Jα probe. (F) Top, schematic of the Tp53 locus showing locations of the Tp53 exons, BglII sites (B2), loxP sites, and 5’Tp53 probe on Tp53WT, Tp53flox, and Tp53Δ alleles. The sizes of BglII fragments from each allele are depicted. Bottom, Southern blots of BglII-digested DNA from the indicated VAp T-ALLs using the 5’Tp53 probe. Bands corresponding to Tp53WT, Tp53flox, and Tp53Δ alleles are indicated. Asterisks indicate tumors with LOH at Tp53.
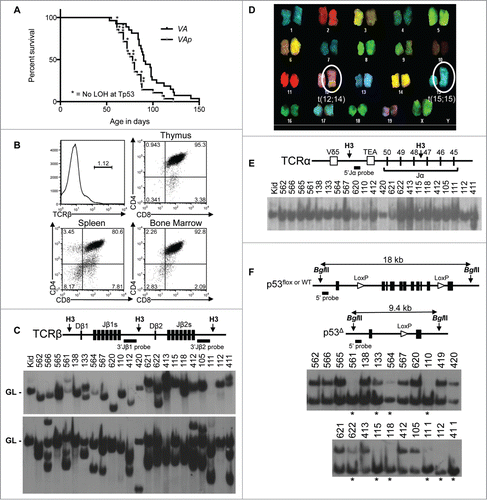
Table 3. Analysis of VAp tumor cohort
Table 4. VAp SKY summary
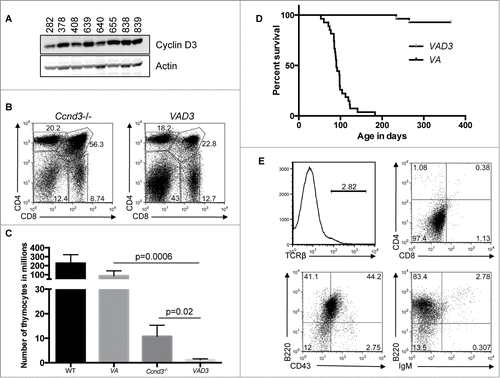
Figure 4. Ccnd3 Drives Transformation of Atm-deficient Thymocytes. (A) Western blot analysis of Ccnd3 and actin expression in the indicated VA T-ALLs. (B) Representative flow cytometry analysis of CD4 and CD8 expression on thymocytes from Ccnd3−/− and VAD3 mice. Indicated on the plots are the frequencies of cells in the DN, DP, CD4+ SP, and CD8+ SP gates. (C) Graph showing the average numbers of total thymocytes from WT (n = 8), VA (n = 10), Ccnd3−/− (n = 5), and VAD3 (n = 3) mice. Error bars are SD. (B and C). This analysis was independently performed more than 3 times. The WT and VA data are also shown in . (D) Kaplan-Meier curves depicting the cancer-free survival of the 28 cohort VAD3 mice and the 27 cohort VA mice from . (E) Flow cytometry analysis of TCRβ, CD4 and CD8, B220 and CD43, or B220 and IgM on VAD3 tumor 676. Gates were drawn using normal thymocytes or splenocytes. Shown are the percentages of cells in each gate.