904
Views
15
CrossRef citations to date
0
Altmetric
Reports

TAp63gamma is required for the late stages of myogenesis

, , , , , & show all
Pages 894-901 | Received 17 Oct 2014, Accepted 07 Nov 2014, Published online: 19 Mar 2015

Figures & data

Figure 1. C2C7 mouse myoblast cells induced to differentiate express TAp63gamma. (A) RT-qPCR quantification of p53 family members RNA extracts from C2C7 myoblast grown in differentiation condition for 24, 48 and 72 hours. (B) mRNA expression of TAp63 isoform highlights its up regulation during skeletal muscle differentiation. (C) Western blot analysis of proteins extracts from C2C7 cells. A TAp63 isoform specific antibody was used to detect TAp63 isoform. Protein extracts from SAOS transfected cells with TAp63alpha and TAp63gamma plasmids were used as positive controls. Beta-actin was used as loading control. (D) Immunostaining for p63 is in green color while in blue is the DAPI staining. All the images are presented as merge of both the channels. One representative experiment of 3 is shown. (E) RT-qPCR and (F) protein gel blot analysis of myogenic regulator factor. Error bars in RT-qPCR indicate the SD of triplicate experiments.
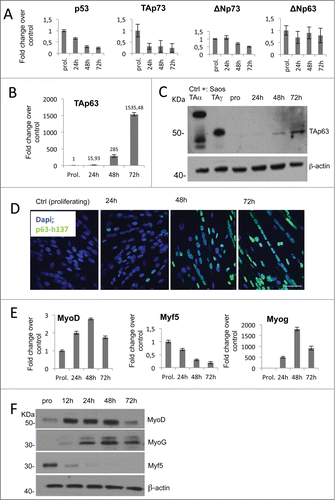
Figure 1. C2C7 mouse myoblast cells induced to differentiate express TAp63gamma. (A) RT-qPCR quantification of p53 family members RNA extracts from C2C7 myoblast grown in differentiation condition for 24, 48 and 72 hours. (B) mRNA expression of TAp63 isoform highlights its up regulation during skeletal muscle differentiation. (C) Western blot analysis of proteins extracts from C2C7 cells. A TAp63 isoform specific antibody was used to detect TAp63 isoform. Protein extracts from SAOS transfected cells with TAp63alpha and TAp63gamma plasmids were used as positive controls. Beta-actin was used as loading control. (D) Immunostaining for p63 is in green color while in blue is the DAPI staining. All the images are presented as merge of both the channels. One representative experiment of 3 is shown. (E) RT-qPCR and (F) protein gel blot analysis of myogenic regulator factor. Error bars in RT-qPCR indicate the SD of triplicate experiments.

Figure 2. Knock-down of TAp63gamma affects late stages of myogenic differentiation in C2C7. (A) RT-qPCR and (B) western blot analysis of C2C7 cells confirm p63 transient silencing after 72 h of differentiation. (C) C2C7 cells scramble transfected (Ctrl) or si-TAp63 (si-p63) were seeded and induced to differentiate for 72 h in differentiate medium. Cells were then fixed and immunostained for MHC (red) to visualize myotubes and counterstained with DAPI (blue) to visualize nuclei. One representative experiment of 3 is shown. (D) Quantification of fusion index. The fusion index (percent differentiation) was determined by dividing the number of nuclei in myotubes-positive by the total number of nuclei in a given microscopic field. Error bars represent the SEM of three independent experiments. Asterisks denote significance (*, P < 0.005). (E) Actin filaments evidentiated by phalloidin-stained Ctrl C2C7 cells versus si-p63. (F) Western blot analysis of proliferation and differentiation markers in Ctrl C2C7 cells (Ctrl-scramble) and si-p63 induced to differentiate for 24, 48 and 72 hours.
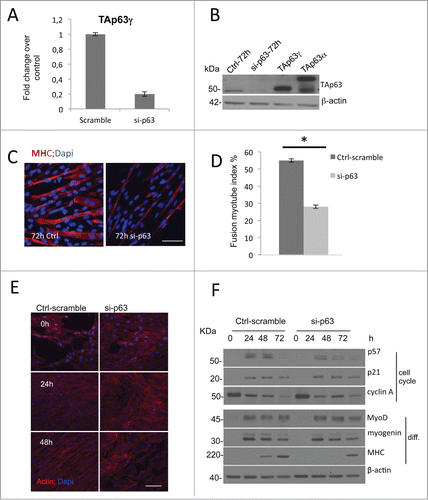
Figure 2. Knock-down of TAp63gamma affects late stages of myogenic differentiation in C2C7. (A) RT-qPCR and (B) western blot analysis of C2C7 cells confirm p63 transient silencing after 72 h of differentiation. (C) C2C7 cells scramble transfected (Ctrl) or si-TAp63 (si-p63) were seeded and induced to differentiate for 72 h in differentiate medium. Cells were then fixed and immunostained for MHC (red) to visualize myotubes and counterstained with DAPI (blue) to visualize nuclei. One representative experiment of 3 is shown. (D) Quantification of fusion index. The fusion index (percent differentiation) was determined by dividing the number of nuclei in myotubes-positive by the total number of nuclei in a given microscopic field. Error bars represent the SEM of three independent experiments. Asterisks denote significance (*, P < 0.005). (E) Actin filaments evidentiated by phalloidin-stained Ctrl C2C7 cells versus si-p63. (F) Western blot analysis of proliferation and differentiation markers in Ctrl C2C7 cells (Ctrl-scramble) and si-p63 induced to differentiate for 24, 48 and 72 hours.

Table 1. Genes expression modulated upon 48 h si-TAp63

Figure 3. Validation of TAp63gamma down-stream genes. mRNA extracted by control (Ctrl-scamble stable clone, Fig. S2A) and stable silenced-p63 (Clone A, Fig. S2A) cells, grown for 48 h in differentiation medium, were analyzed by RT-qPCR. (A) RT-qPCR showing p63 knockdown. (B) RT-qPCR to detect Pax7, “skeletal myogenesis” category. (C-H) RT-qPCR of genes involved in “skeletal muscle contractility” category. (I) RT-qPCR for Igf2, “autocrine signaling” category. (J) RT-qPCR for HK2, “energy metabolism” category. (K-M) RT-qPCR for Prkag3 and Pparg, “metabolic syndrome” category. (L) RT-qPCR for Mmp9, “wasting atrophy” category. The categories indicated are the one described in . Data are shown as the mean of 3 experiments +/− standard deviation.
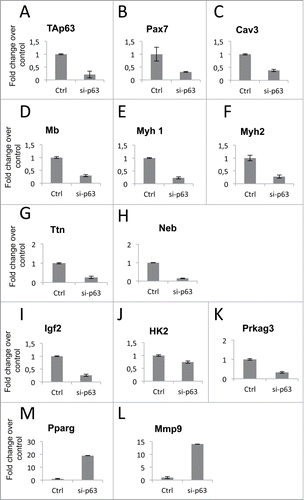
Figure 3. Validation of TAp63gamma down-stream genes. mRNA extracted by control (Ctrl-scamble stable clone, Fig. S2A) and stable silenced-p63 (Clone A, Fig. S2A) cells, grown for 48 h in differentiation medium, were analyzed by RT-qPCR. (A) RT-qPCR showing p63 knockdown. (B) RT-qPCR to detect Pax7, “skeletal myogenesis” category. (C-H) RT-qPCR of genes involved in “skeletal muscle contractility” category. (I) RT-qPCR for Igf2, “autocrine signaling” category. (J) RT-qPCR for HK2, “energy metabolism” category. (K-M) RT-qPCR for Prkag3 and Pparg, “metabolic syndrome” category. (L) RT-qPCR for Mmp9, “wasting atrophy” category. The categories indicated are the one described in Table 1. Data are shown as the mean of 3 experiments +/− standard deviation.
Supplemental material

988021_Supplemental_Material.pdf

Download PDF (231.9 KB)

Reprints and Corporate Permissions

Please note: Selecting permissions does not provide access to the full text of the article, please see our help page How do I view content?

To request a reprint or corporate permissions for this article, please click on the relevant link below:

Academic Permissions

Please note: Selecting permissions does not provide access to the full text of the article, please see our help page How do I view content?

Obtain permissions instantly via Rightslink by clicking on the button below:

If you are unable to obtain permissions via Rightslink, please complete and submit this Permissions form. For more information, please visit our Permissions help page.