2,626
Views
31
CrossRef citations to date
0
Altmetric
EXTRA VIEWS

Cell competition: Winning out by losing notch

&
Pages 9-17 | Received 23 Oct 2014, Accepted 11 Nov 2014, Published online: 20 Jan 2015

Figures & data

Figure 1. Stochastic cell fate behavior of normal mouse esophageal epithelium. (A) Section of mouse esophageal epithelium showing multilayered squamous tissue devoid of appendages. Basal cells (b) overlie a basement membrane (dashed line) above submucosa. Basal cells stratify into suprabasal layers (sb), migrating toward the surface of the epithelium, lined by cornified cells (c), which are continually shed into the esophageal lumen. Scale bar 50 μm. (B) Side view of a 3-dimensional reconstruction showing typical EYFP labeled (control) clones 10 d post induction.Citation24 EYFP is green and α6 integrin in white, scale bar 10 μm, b indicates a basal cell and sb suprabasal cells. (C) Cell fate in normal homeostatic mouse esophageal epithelium.Citation24 Progenitor cell division is linked to the exit of a nearby differentiating cell from the basal layer. The average rates of progenitor cell division and differentiated cell stratification are 1.9/week and 3.5 /week respectively. Each division may have one of 3 outcomes: 2 progenitor daughters, 2 differentiating daughters (a terminal division in which neither daughter divides again) or one cell of each type. The outcome of an individual division is unpredictable, but the likelihood of each division outcome, indicated as a percentage, is the same for all progenitors.
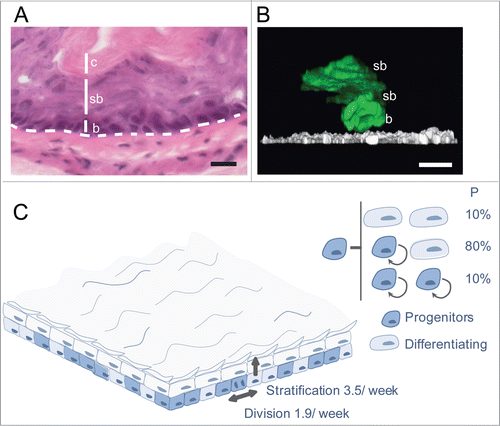
Figure 1. Stochastic cell fate behavior of normal mouse esophageal epithelium. (A) Section of mouse esophageal epithelium showing multilayered squamous tissue devoid of appendages. Basal cells (b) overlie a basement membrane (dashed line) above submucosa. Basal cells stratify into suprabasal layers (sb), migrating toward the surface of the epithelium, lined by cornified cells (c), which are continually shed into the esophageal lumen. Scale bar 50 μm. (B) Side view of a 3-dimensional reconstruction showing typical EYFP labeled (control) clones 10 d post induction.Citation24 EYFP is green and α6 integrin in white, scale bar 10 μm, b indicates a basal cell and sb suprabasal cells. (C) Cell fate in normal homeostatic mouse esophageal epithelium.Citation24 Progenitor cell division is linked to the exit of a nearby differentiating cell from the basal layer. The average rates of progenitor cell division and differentiated cell stratification are 1.9/week and 3.5 /week respectively. Each division may have one of 3 outcomes: 2 progenitor daughters, 2 differentiating daughters (a terminal division in which neither daughter divides again) or one cell of each type. The outcome of an individual division is unpredictable, but the likelihood of each division outcome, indicated as a percentage, is the same for all progenitors.

Figure 2 (See previous page). Notch inhibition confers clonal dominance. (A) Side views of 3-dimensional reconstructions of confocal z stacks showing clonal areas of wholemounts of esophageal epithelium immunostained for DN-Maml1 (green) at one month and 1 year post induction. Dapi is blue, scale bars 500 μm. (B) Effect of clonal DN-Maml1 expression on progenitor cell dynamics. At early time points DN-Maml1 expression (green) increases the rate of progenitor cell division and decreases the rate of differentiating cell stratification. In addition, divisions resulting in 2 differentiating cells are absent, blocking clone loss by differentiation. In combination these changes result in exponential clonal expansion in a background of wild type cells (blue). (C) Notch inhibition induces differentiation of adjacent wild type cells. Side view of 3-dimensional reconstructions showing typical appearances of DN-Maml1 induced and uninduced age-matched control epithelial wholemounts. Progenitor cells were labeled with a pulse of Ethinyl deoxy Uridine (EdU, red), taken up by progenitors that were in S phase 48 hours before staining. At the boundary of a DN-Maml1 clone (green), an increased proportion of non-mutant suprabasal EdU+ cells (arrowed) is seen compared with controls, indicative of an increased rate of progenitor differentiation. Dotted line indicates basement membrane, scale bars 10 μm. (D) XZ cross sections of a wholemount confocal z-stack from DN-Maml1 induced treated with EdU as described in (C). Accelerated stratification at the wild type edge shows typical markers of esophageal differentiation. GFP green, EdU is red and differentiation marker Keratin 4 white, dotted line indicates basement membrane, arrows suprabasal EdU positive cells. Scale bars 10 μm. (E) Model of wild type cell elimination through competition with Notch mutant cells. Notch signaling is activated preferentially in wild type cells at the clonal edges due to inhibition of Notch pathway in mutant cells. This prompts stratification and differentiation of wild type progenitors. Clone expansion is accelerated by the active expulsion of wild type cells through differentiation.
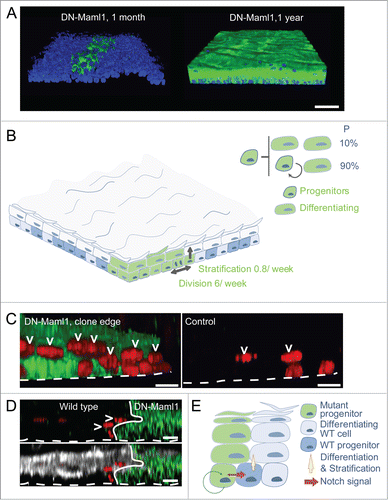
Figure 2 (See previous page). Notch inhibition confers clonal dominance. (A) Side views of 3-dimensional reconstructions of confocal z stacks showing clonal areas of wholemounts of esophageal epithelium immunostained for DN-Maml1 (green) at one month and 1 year post induction. Dapi is blue, scale bars 500 μm. (B) Effect of clonal DN-Maml1 expression on progenitor cell dynamics. At early time points DN-Maml1 expression (green) increases the rate of progenitor cell division and decreases the rate of differentiating cell stratification. In addition, divisions resulting in 2 differentiating cells are absent, blocking clone loss by differentiation. In combination these changes result in exponential clonal expansion in a background of wild type cells (blue). (C) Notch inhibition induces differentiation of adjacent wild type cells. Side view of 3-dimensional reconstructions showing typical appearances of DN-Maml1 induced and uninduced age-matched control epithelial wholemounts. Progenitor cells were labeled with a pulse of Ethinyl deoxy Uridine (EdU, red), taken up by progenitors that were in S phase 48 hours before staining. At the boundary of a DN-Maml1 clone (green), an increased proportion of non-mutant suprabasal EdU+ cells (arrowed) is seen compared with controls, indicative of an increased rate of progenitor differentiation. Dotted line indicates basement membrane, scale bars 10 μm. (D) XZ cross sections of a wholemount confocal z-stack from DN-Maml1 induced treated with EdU as described in (C). Accelerated stratification at the wild type edge shows typical markers of esophageal differentiation. GFP green, EdU is red and differentiation marker Keratin 4 white, dotted line indicates basement membrane, arrows suprabasal EdU positive cells. Scale bars 10 μm. (E) Model of wild type cell elimination through competition with Notch mutant cells. Notch signaling is activated preferentially in wild type cells at the clonal edges due to inhibition of Notch pathway in mutant cells. This prompts stratification and differentiation of wild type progenitors. Clone expansion is accelerated by the active expulsion of wild type cells through differentiation.

Figure 3. Cell dynamics after complete epithelial replacement by DN-Maml1 cells. (A) At long time points after induction, the entire esophageal epithelium is replaced by DN-Maml1 mutant cells (green). As this happens, the 3 division outcomes of normal progenitor cells are reinstated, with balanced probabilities. Tissue turnover is still accelerated, but a new ‘steady-state’ is reached. (B) Section of mouse esophageal epithelium showing epithelial buckling at 1 year post-induction in DM-Maml1 mice compared to aged-matched uninduced controls. Scale bar 20 μm. (C) Side view of 3-dimensional reconstructions of confocal images showing increased cell density (arrows) one year post induction in DM-Maml1 mutant epithelium compared to aged-matched uninduced controls. Basal cell marker Keratin 14 is red, suprabasal marker Keratin 4 in white, and Dapi blue. Dotted line indicates basement membrane, brackets indicate epithelial thickness. Scale bar 10 μm.
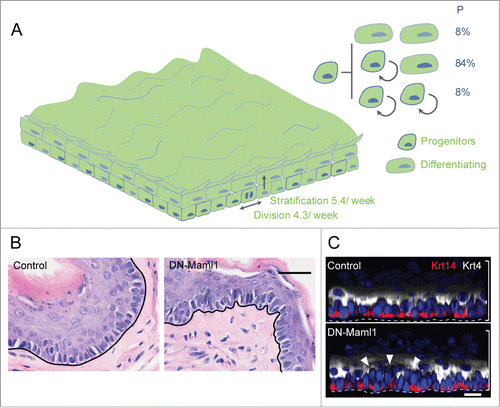
Figure 3. Cell dynamics after complete epithelial replacement by DN-Maml1 cells. (A) At long time points after induction, the entire esophageal epithelium is replaced by DN-Maml1 mutant cells (green). As this happens, the 3 division outcomes of normal progenitor cells are reinstated, with balanced probabilities. Tissue turnover is still accelerated, but a new ‘steady-state’ is reached. (B) Section of mouse esophageal epithelium showing epithelial buckling at 1 year post-induction in DM-Maml1 mice compared to aged-matched uninduced controls. Scale bar 20 μm. (C) Side view of 3-dimensional reconstructions of confocal images showing increased cell density (arrows) one year post induction in DM-Maml1 mutant epithelium compared to aged-matched uninduced controls. Basal cell marker Keratin 14 is red, suprabasal marker Keratin 4 in white, and Dapi blue. Dotted line indicates basement membrane, brackets indicate epithelial thickness. Scale bar 10 μm.

Figure 4. A cellular mechanism of field change. In carcinogen exposed tissues mutations in genes such as p53 (red) are frequent. However, stochastic differentiation leads to most such mutant clones being shed from the epithelium (marked X). However, if a p53 mutant cell is subject to a Notch inhibiting mutation, it achieves clonal dominance. Over time the double mutant clone expands to colonize a large area, resulting in a region of epithelium at increased risk of malignant transformation as it acquires further mutations.
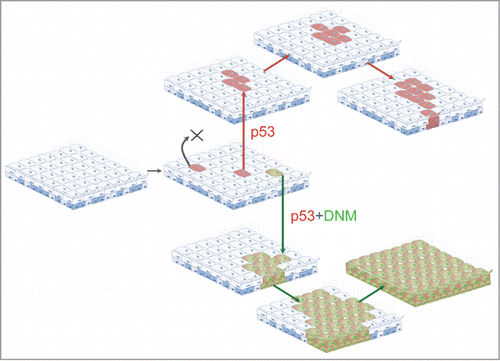
Figure 4. A cellular mechanism of field change. In carcinogen exposed tissues mutations in genes such as p53 (red) are frequent. However, stochastic differentiation leads to most such mutant clones being shed from the epithelium (marked X). However, if a p53 mutant cell is subject to a Notch inhibiting mutation, it achieves clonal dominance. Over time the double mutant clone expands to colonize a large area, resulting in a region of epithelium at increased risk of malignant transformation as it acquires further mutations.