3,993
Views
10
CrossRef citations to date
0
Altmetric
Extra View

Nuclear transcriptome profiling of induced pluripotent stem cells and embryonic stem cells identify non-coding loci resistant to reprogramming

, , , &
Pages 1148-1155 | Received 06 Nov 2014, Accepted 07 Jan 2015, Published online: 18 Apr 2015

Figures & data

Figure 1. (A) Hierarchical clustering based on Euclidian distance matrix for expression values of all CAGE-tag-clusters (B) Fold-change values (FC) density for the differential expression analyses on the nuclear (Nu) and cytoplasmic (Cy) datasets. CAGE-clusters found differentially expressed in both analyses (Nu/Cy) are marked in blue. (C) Comparison of transcriptional complexity in the nuclear and cytoplasmic compartments of ESC and iPSC cells, calculating the number of CAGE clusters detected in each sample after sub-sampling of CAGE tags (richness). Red bars represent mean values. P-values from 2-sided t-test are shown. (D) Annotation of CAGE-tag-clusters significantly up-regulated in ESC (edgeR, FDR< 0.05, FC>8). (E) Histone marks (ENCODE ChIP-seq dataCitation7) based classification of CAGE tag clusters significantly upregulated in ESC.
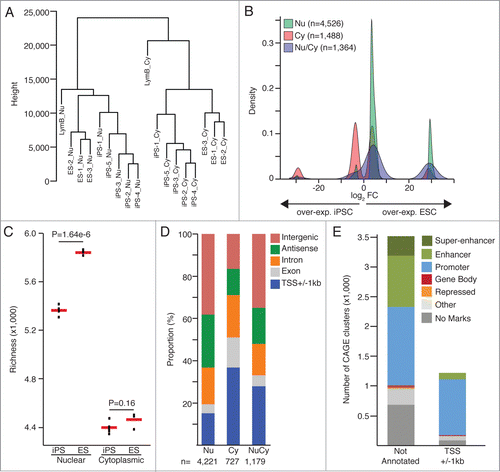
Figure 1. (A) Hierarchical clustering based on Euclidian distance matrix for expression values of all CAGE-tag-clusters (B) Fold-change values (FC) density for the differential expression analyses on the nuclear (Nu) and cytoplasmic (Cy) datasets. CAGE-clusters found differentially expressed in both analyses (Nu/Cy) are marked in blue. (C) Comparison of transcriptional complexity in the nuclear and cytoplasmic compartments of ESC and iPSC cells, calculating the number of CAGE clusters detected in each sample after sub-sampling of CAGE tags (richness). Red bars represent mean values. P-values from 2-sided t-test are shown. (D) Annotation of CAGE-tag-clusters significantly up-regulated in ESC (edgeR, FDR< 0.05, FC>8). (E) Histone marks (ENCODE ChIP-seq dataCitation7) based classification of CAGE tag clusters significantly upregulated in ESC.

Figure 2. (A) Mean DNaseI hypersensitivity signal density (ENCODE data, ES-E14 cellsCitation7) and (B) mean ChIP-Seq signal density for Mediator subunits Med1 and Med12Citation14 for the not annotated super-enhancer, enhancer and annotated TSSs. (C) Normalized nuclear expression (tpm: tags per million) and (D) mean PhastCons score (Euarchontoglires, 30 species, UCSC) for the CAGE tag clusters significantly up-regulated in ESC (edgeR, FDR < 0.05, FC > 8).
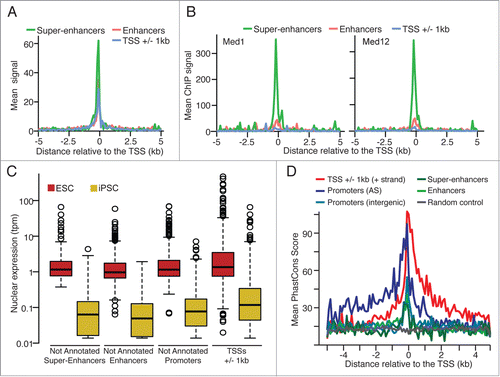
Figure 2. (A) Mean DNaseI hypersensitivity signal density (ENCODE data, ES-E14 cellsCitation7) and (B) mean ChIP-Seq signal density for Mediator subunits Med1 and Med12Citation14 for the not annotated super-enhancer, enhancer and annotated TSSs. (C) Normalized nuclear expression (tpm: tags per million) and (D) mean PhastCons score (Euarchontoglires, 30 species, UCSC) for the CAGE tag clusters significantly up-regulated in ESC (edgeR, FDR < 0.05, FC > 8).

Figure 3 (See previous page). (A) Repeat composition of not annotated (super-enhancers, enhancers, promoters) and annotated (TSSs +/-1kb) CAGE-tag-clusters significantly overexpressed in ESC. All CAGE-tag-clusters composition is shown for comparison. (B) Proportion of overlap with Non-Annotates-Stem-Transcripts (NAST) from Fort et al.Citation8 (C and D) Normalized expression values for super-enhancer regions and their associated protein coding genes (C) or lncRNAs (D). Schematic representations of genomic configurations are shown above plots. Error bars, s.d. Indicated P-values are from 2-sided t-tests. iPSC n = 5 , ESC n = 3.
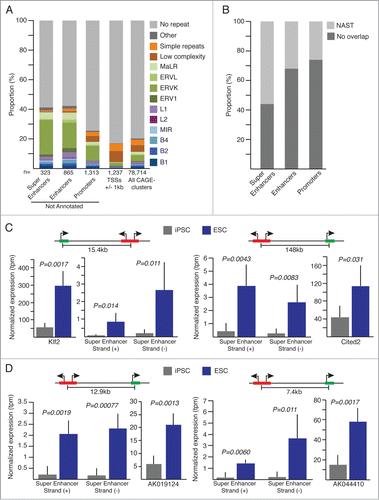
Figure 3 (See previous page). (A) Repeat composition of not annotated (super-enhancers, enhancers, promoters) and annotated (TSSs +/-1kb) CAGE-tag-clusters significantly overexpressed in ESC. All CAGE-tag-clusters composition is shown for comparison. (B) Proportion of overlap with Non-Annotates-Stem-Transcripts (NAST) from Fort et al.Citation8 (C and D) Normalized expression values for super-enhancer regions and their associated protein coding genes (C) or lncRNAs (D). Schematic representations of genomic configurations are shown above plots. Error bars, s.d. Indicated P-values are from 2-sided t-tests. iPSC n = 5 , ESC n = 3.
Supplemental material

988031_Supplementary_Materials.zip

Download Zip (2.7 MB)

988031_Supplementary_Materials.zip

Download Zip (2.8 MB)