10,129
Views
86
CrossRef citations to date
0
Altmetric
Reports

Fucci2a: A bicistronic cell cycle reporter that allows Cre mediated tissue specific expression in mice

, , , , , , , , & show all
Pages 2681-2696 | Received 01 May 2014, Accepted 04 Jun 2014, Published online: 30 Oct 2014

Figures & data

Figure 1. Design and validation of bicistronic Fucci2a expression constructs. (A) The Fucci2 probes mVenus-hGem(1/110) and mCherry-hCdt1(30/120) were fused using the Thosea asigna virus 2A peptide, the core T2A sequence is highlighted in blue and was inserted between the Fucci2 probes in both orientations. The T2A sequence comprises 18 amino acids, cleavage occurs between the final glycine and proline (arrow in A). In addition to these 17 amino acids 2 amino acids were added to create an MfeI restriction site for cloning; in total the 5′ Fucci probe has 19 amino acids added to its C-terminus while the 3′ Fucci probe incorporates one additional amino acid. (B) The resulting 2 versions of Fucci2a were termed Fucci2a-5C3V (5′ mCherry-hCdt1(30/120) 3′ mVenus-hGem(1/110)) and Fucci2a-5V3C (5′ mVenus-hGem(1/110) 3′ mCherry-hCdt1(30/120)) and were targeted to a single locus in NIH 3T3 cells using the Flp-In system to create 2 isogenic polyclonal Fucci2a cell lines. (C–J) Imaging of the resulting stable cell lines revealed that the addition of the 19 T2A amino acids resulted in mVenus-hGem(1/110) partially loosing its nuclear localization, mCherry-hCdt1(30/120) remained nuclear with the same addition (compare C to G and D to H). (K) Quantification of the nuclear to cytoplasmic ratio for both Fucci2 probes for the 2 Fucci2a cell lines revealed a statistically significant increase in the nuclear to cytoplasmic ratio of mVenus-hGem(1/110) in the Fucci2a-5V3C cell line (2-way ANOVA P = <0.0001, Tukey's HSD P < 0.0001). (L) Summary of the initial characterization showing that only mVenus-hGem(1/110) is sensitive to the additional 18 amino acids. Error bars in K = 95% Confidence interval.
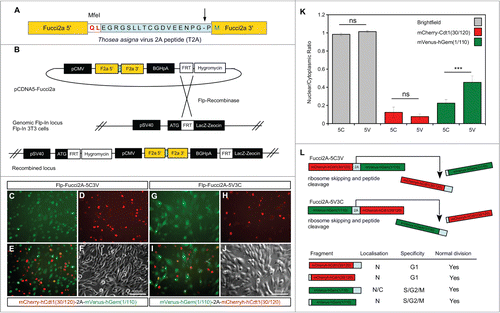
Figure 1. Design and validation of bicistronic Fucci2a expression constructs. (A) The Fucci2 probes mVenus-hGem(1/110) and mCherry-hCdt1(30/120) were fused using the Thosea asigna virus 2A peptide, the core T2A sequence is highlighted in blue and was inserted between the Fucci2 probes in both orientations. The T2A sequence comprises 18 amino acids, cleavage occurs between the final glycine and proline (arrow in A). In addition to these 17 amino acids 2 amino acids were added to create an MfeI restriction site for cloning; in total the 5′ Fucci probe has 19 amino acids added to its C-terminus while the 3′ Fucci probe incorporates one additional amino acid. (B) The resulting 2 versions of Fucci2a were termed Fucci2a-5C3V (5′ mCherry-hCdt1(30/120) 3′ mVenus-hGem(1/110)) and Fucci2a-5V3C (5′ mVenus-hGem(1/110) 3′ mCherry-hCdt1(30/120)) and were targeted to a single locus in NIH 3T3 cells using the Flp-In system to create 2 isogenic polyclonal Fucci2a cell lines. (C–J) Imaging of the resulting stable cell lines revealed that the addition of the 19 T2A amino acids resulted in mVenus-hGem(1/110) partially loosing its nuclear localization, mCherry-hCdt1(30/120) remained nuclear with the same addition (compare C to G and D to H). (K) Quantification of the nuclear to cytoplasmic ratio for both Fucci2 probes for the 2 Fucci2a cell lines revealed a statistically significant increase in the nuclear to cytoplasmic ratio of mVenus-hGem(1/110) in the Fucci2a-5V3C cell line (2-way ANOVA P = <0.0001, Tukey's HSD P < 0.0001). (L) Summary of the initial characterization showing that only mVenus-hGem(1/110) is sensitive to the additional 18 amino acids. Error bars in K = 95% Confidence interval.

Figure 2. Live imaging of Fucci2a stable 3T3 cell line. (A) A montage of a time-lapse sequence showing nuclear expression of Fucci2a throughout the progressing cell cycle. mCherry accumulates during G1 and is lost during the G1/S transition as mVenus reaches its peak. Both probes are lost at mitosis (asterisk in final panel). (B) Plot of the relative intensities of the Fucci2a probes during a single cell cycle showing the mCherry and mVenus peaks. (C) Confirmation by FACS that the Fucci2a probes accurately predict cell cycle phase defined by DAPI staining for DNA content. Cells positive for mCherry peak in the G1/2n population, while mVenus positive cells peak in the 4n population immediately prior to mitosis. (D) Quantification of the length of cell cycle phases by live cell imaging and image analysis. Increasing the serum concentration from 10–15% resulted in a statistically significant shortening of the cell cycle (students t-test with Bonferroni correction P < 0.001) and a reduction in the length of G1 ( students t-test with Bonferroni correction P < 0.05). Tc = cell cycle time; Tg1 = G1 length; Tsg2m = S/G2/M length; Ts = G1/S transition length. Error bars in D = 95% Confidence interval.
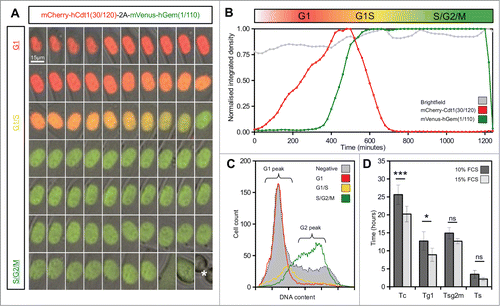
Figure 2. Live imaging of Fucci2a stable 3T3 cell line. (A) A montage of a time-lapse sequence showing nuclear expression of Fucci2a throughout the progressing cell cycle. mCherry accumulates during G1 and is lost during the G1/S transition as mVenus reaches its peak. Both probes are lost at mitosis (asterisk in final panel). (B) Plot of the relative intensities of the Fucci2a probes during a single cell cycle showing the mCherry and mVenus peaks. (C) Confirmation by FACS that the Fucci2a probes accurately predict cell cycle phase defined by DAPI staining for DNA content. Cells positive for mCherry peak in the G1/2n population, while mVenus positive cells peak in the 4n population immediately prior to mitosis. (D) Quantification of the length of cell cycle phases by live cell imaging and image analysis. Increasing the serum concentration from 10–15% resulted in a statistically significant shortening of the cell cycle (students t-test with Bonferroni correction P < 0.001) and a reduction in the length of G1 ( students t-test with Bonferroni correction P < 0.05). Tc = cell cycle time; Tg1 = G1 length; Tsg2m = S/G2/M length; Ts = G1/S transition length. Error bars in D = 95% Confidence interval.

Figure 3. Comparison of mitosis times for daughter cell pairs. (A) Correlation of mitosis times for daughter cell pairs was highly statistically significant (Spearman's rank order correlation P < 0.001, rs = 0.7) (B) There was no correlation between the same data if the pairs were assigned randomly (Spearman's rank order correlation P = 0.9, rs = −0.04). Tc = cell cycle time.
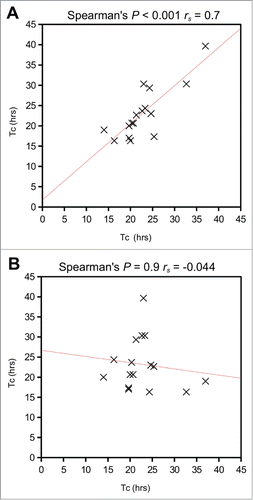
Figure 3. Comparison of mitosis times for daughter cell pairs. (A) Correlation of mitosis times for daughter cell pairs was highly statistically significant (Spearman's rank order correlation P < 0.001, rs = 0.7) (B) There was no correlation between the same data if the pairs were assigned randomly (Spearman's rank order correlation P = 0.9, rs = −0.04). Tc = cell cycle time.

Figure 4. Mouse embryonic stem cells expressing Fucci2a. A single copy of the Fucci2a transgene under the control of the CAG promoter was inserted into the Rosa26 locus by homologous recombination in mouse embryonic stem cells (mESCs). (A) Targeting construct used, a stop cassette containing a loxP flanked neomycin resistance gene and polyadenylation sequence was inserted between CAG and Fucci2a, this construct was inserted in the reverse orientation to the endogenous Rosa26 promoter to avoid transcriptional interference. (B) The targeted R26Fucci2aR inducible allele, screening for correct homologous recombination was done using PCR across the 5′ and 3′ homology arms of the targeting construct. To test the R26Fucci2aR ES cell lines they were transfected with a Cre-recombinase expressing plasmid (pPGK-Cre), plated at low density and screened for G418 sensitive Fucci2a expressing clones (R26Fucci2a). (C) The targeted R26Fucci2a allele after Cre-mediated excision of the floxed-Neo-pA stop cassette. (D) R26Fucci2a ES cells showed high levels of mVenus in the majority of cells but very few mCherry positive cells were evident. (E) However on withdrawal of Lif and culture in the presence of retinoic acid (RA) for 4 days high proportions of mCherry positive cells were evident. (F and G) FACS analysis showed that there were a large proportion of cells negative for both markers in R26Fucci2a ES cells and that on Lif removal and RA treatment the negative population was reduced and an mCherry positive population became apparent. (H and I) Quantification of DNA content by DAPI staining followed by FACS analysis showed clearly that the majority of G1 cells were negative for mCherry in the R26Fucci2a clone. After Lif withdrawal and culture in the presence of RA for 4 days, a G1 population of mCherry positive cells became apparent.
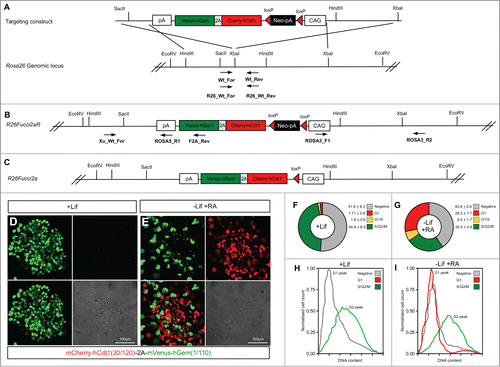
Figure 4. Mouse embryonic stem cells expressing Fucci2a. A single copy of the Fucci2a transgene under the control of the CAG promoter was inserted into the Rosa26 locus by homologous recombination in mouse embryonic stem cells (mESCs). (A) Targeting construct used, a stop cassette containing a loxP flanked neomycin resistance gene and polyadenylation sequence was inserted between CAG and Fucci2a, this construct was inserted in the reverse orientation to the endogenous Rosa26 promoter to avoid transcriptional interference. (B) The targeted R26Fucci2aR inducible allele, screening for correct homologous recombination was done using PCR across the 5′ and 3′ homology arms of the targeting construct. To test the R26Fucci2aR ES cell lines they were transfected with a Cre-recombinase expressing plasmid (pPGK-Cre), plated at low density and screened for G418 sensitive Fucci2a expressing clones (R26Fucci2a). (C) The targeted R26Fucci2a allele after Cre-mediated excision of the floxed-Neo-pA stop cassette. (D) R26Fucci2a ES cells showed high levels of mVenus in the majority of cells but very few mCherry positive cells were evident. (E) However on withdrawal of Lif and culture in the presence of retinoic acid (RA) for 4 days high proportions of mCherry positive cells were evident. (F and G) FACS analysis showed that there were a large proportion of cells negative for both markers in R26Fucci2a ES cells and that on Lif removal and RA treatment the negative population was reduced and an mCherry positive population became apparent. (H and I) Quantification of DNA content by DAPI staining followed by FACS analysis showed clearly that the majority of G1 cells were negative for mCherry in the R26Fucci2a clone. After Lif withdrawal and culture in the presence of RA for 4 days, a G1 population of mCherry positive cells became apparent.

Figure 5. Ubiquitous expression of Fucci2a in R26Fucci2aR+/Tg/CAG-Cre+ve embryos. (A–D) Whole mount R26Fucci2aR+/Tg/CAG-Cre+ve embryonic trunk at E11.5. Fucci2a expression and localization is clearly apparent with red green and yellow cells evident. (E–H) Whole mount R26Fucci2aR+/Tg/CAG-Cre+ve embryonic limb bud at E11.5. Clear areas of mCherry-hCdt1(30/120) positive cells are evident in the condensing mesenchyme that will go on to form the future bone while the interdigitary areas are still highly proliferative. (I–L) A R26Fucci2aR+/Tg/CAG-Cre+ve E11.5 embryonic lung cultured for 24 hours, there is a clear bias in the distribution of cells in G1 and S/G2/M. The actively branching regions of the developing lung are highly proliferative while the future bronchial regions have begun to drop out of the cell cycle as demonstrated by the high proportion of G1 cells in these regions (dotted regions in I, J, K). (M–P) A dissected R26Fucci2aR+/Tg/CAG-Cre+ve E11.5 embryonic kidney cultured for 24hrs. Cells in S, G2, and M-phase were primarily detected within the ureteric bud and in clusters of cells immediately adjacent to the bud comprising early nephron structures. The cap mesenchyme was largely populated by cells in G1.
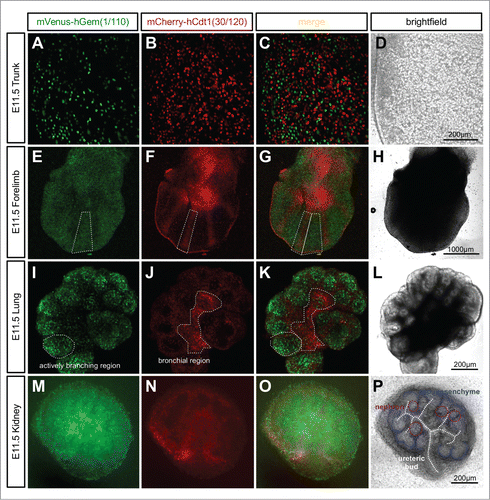
Figure 5. Ubiquitous expression of Fucci2a in R26Fucci2aR+/Tg/CAG-Cre+ve embryos. (A–D) Whole mount R26Fucci2aR+/Tg/CAG-Cre+ve embryonic trunk at E11.5. Fucci2a expression and localization is clearly apparent with red green and yellow cells evident. (E–H) Whole mount R26Fucci2aR+/Tg/CAG-Cre+ve embryonic limb bud at E11.5. Clear areas of mCherry-hCdt1(30/120) positive cells are evident in the condensing mesenchyme that will go on to form the future bone while the interdigitary areas are still highly proliferative. (I–L) A R26Fucci2aR+/Tg/CAG-Cre+ve E11.5 embryonic lung cultured for 24 hours, there is a clear bias in the distribution of cells in G1 and S/G2/M. The actively branching regions of the developing lung are highly proliferative while the future bronchial regions have begun to drop out of the cell cycle as demonstrated by the high proportion of G1 cells in these regions (dotted regions in I, J, K). (M–P) A dissected R26Fucci2aR+/Tg/CAG-Cre+ve E11.5 embryonic kidney cultured for 24hrs. Cells in S, G2, and M-phase were primarily detected within the ureteric bud and in clusters of cells immediately adjacent to the bud comprising early nephron structures. The cap mesenchyme was largely populated by cells in G1.

Figure 6. Live confocal imaging of branching morphogenesis during lung development. Lungs were cultured ex vivo from E11.5. (A and B) An elongating branch of lung epithelium begins to bifurcate at right angles to the plane of imaging (white dots and arrows in B). (C) Cells in the distal tip of the extending branch of lung epithelium are proliferating rapidly shown by the high proportion of S/G2/M (green) nuclei. (D and E) The left and right branches elongate driven by proliferation at the growing tip. By 34.5 hours a daughter branch can be seen to emerge from the left parent branch by domain branching (blue dot and arrow in E). (F) In contrast to the epithelial branch the surrounding mesenchyme is composed of cells predominantly in G1/G0 (red). (G and H) Subsequently the right parent branch bulges and then bifurcates into 2 sister branches (magenta arrows and dots in H). (I) In the proximal regions of the branching lung epithelium cells begin to exit the cell cycle and enter G1/G0 (red). Abbreviations: mes = mesenchyme.
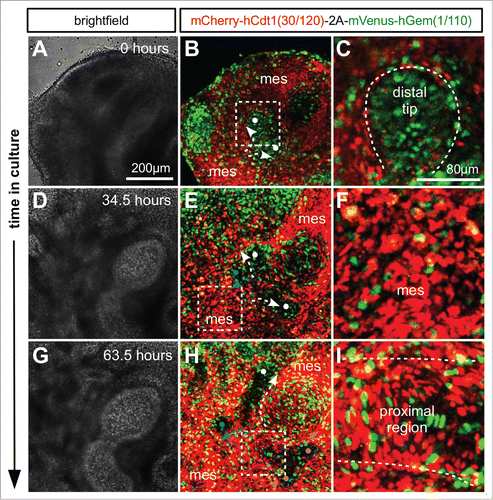
Figure 6. Live confocal imaging of branching morphogenesis during lung development. Lungs were cultured ex vivo from E11.5. (A and B) An elongating branch of lung epithelium begins to bifurcate at right angles to the plane of imaging (white dots and arrows in B). (C) Cells in the distal tip of the extending branch of lung epithelium are proliferating rapidly shown by the high proportion of S/G2/M (green) nuclei. (D and E) The left and right branches elongate driven by proliferation at the growing tip. By 34.5 hours a daughter branch can be seen to emerge from the left parent branch by domain branching (blue dot and arrow in E). (F) In contrast to the epithelial branch the surrounding mesenchyme is composed of cells predominantly in G1/G0 (red). (G and H) Subsequently the right parent branch bulges and then bifurcates into 2 sister branches (magenta arrows and dots in H). (I) In the proximal regions of the branching lung epithelium cells begin to exit the cell cycle and enter G1/G0 (red). Abbreviations: mes = mesenchyme.

Figure 7. Ex vivo time-lapse imaging of mouse embryonic kidney development. (A–C) Part of an E12.5 kidney after 4.5 hours in culture. The cap mesenchyme contains a larger proportion of cells in G1 (red) than either ureteric bud or renal vesicles. The renal vesicles in particular contain tight condensations of cells predominately in S/G2/M (green). (D–F) After 45 hours in culture the S-shaped bodies have formed and while the majority of cells were still cycling it was clear that the presumptive podocytes of the visceral epithelium were beginning to exit the cell cycle and enter G1/G0 (red). (G–I) By 68.5 hours in culture the majority of podocytes in the mature glomerular structures appeared to have exited the cell cycle. Abbreviations: cm = cap mesenchyme, ub = ureteric bud; rv = renal vesicle; v.ep = visceral epithelium; p.ep = parietal epithelium; sb = S-shaped body.
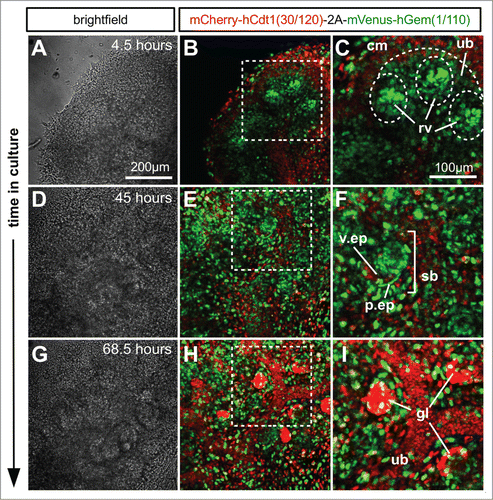
Figure 7. Ex vivo time-lapse imaging of mouse embryonic kidney development. (A–C) Part of an E12.5 kidney after 4.5 hours in culture. The cap mesenchyme contains a larger proportion of cells in G1 (red) than either ureteric bud or renal vesicles. The renal vesicles in particular contain tight condensations of cells predominately in S/G2/M (green). (D–F) After 45 hours in culture the S-shaped bodies have formed and while the majority of cells were still cycling it was clear that the presumptive podocytes of the visceral epithelium were beginning to exit the cell cycle and enter G1/G0 (red). (G–I) By 68.5 hours in culture the majority of podocytes in the mature glomerular structures appeared to have exited the cell cycle. Abbreviations: cm = cap mesenchyme, ub = ureteric bud; rv = renal vesicle; v.ep = visceral epithelium; p.ep = parietal epithelium; sb = S-shaped body.

Figure 8. Lineage specific Fucci2a expression in developing melanoblasts. (A and B) Embryonic skin in culture from a Tyr::Cre+ve/R26EYFPRTg/+ embryo at E14.5. EYFP positive melanoblasts show their characteristically dendritic morphology. (C–F) Embryonic skin in culture from a Tyr::Cre+ve/R26Fucci2aRTg/+ positive embryo at E14.5, melanoblasts from all stages of the cell cycle are visible. (G) Quantification of the proportions of melanoblast in the 3 cell cycle phases in E14.5 embryonic skin samples (n = 10 embryos). (H) Automated cell tracking of mVenus-hGem(1/110) labeled melanoblasts (in S/G2/M) over an 18 hour time-lapse sequence showing the population spread. (I) Automated cell tracking of mCherry-hCdt1(30/120) labeled melanoblasts (in G1) over an 18 hour time-lapse sequence showing the population spread. Error values in G = 95% confidence intervals.
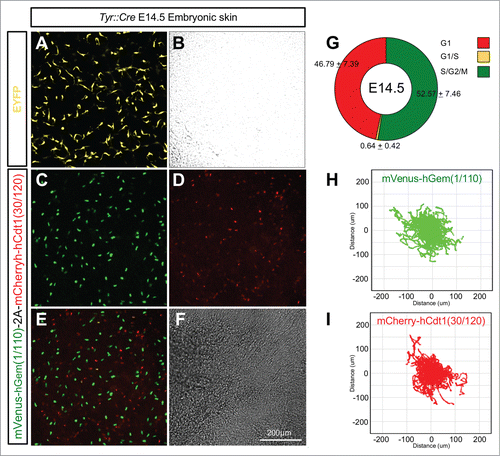
Figure 8. Lineage specific Fucci2a expression in developing melanoblasts. (A and B) Embryonic skin in culture from a Tyr::Cre+ve/R26EYFPRTg/+ embryo at E14.5. EYFP positive melanoblasts show their characteristically dendritic morphology. (C–F) Embryonic skin in culture from a Tyr::Cre+ve/R26Fucci2aRTg/+ positive embryo at E14.5, melanoblasts from all stages of the cell cycle are visible. (G) Quantification of the proportions of melanoblast in the 3 cell cycle phases in E14.5 embryonic skin samples (n = 10 embryos). (H) Automated cell tracking of mVenus-hGem(1/110) labeled melanoblasts (in S/G2/M) over an 18 hour time-lapse sequence showing the population spread. (I) Automated cell tracking of mCherry-hCdt1(30/120) labeled melanoblasts (in G1) over an 18 hour time-lapse sequence showing the population spread. Error values in G = 95% confidence intervals.

Table 1. Available Fucci2a resources and repository information

Table 2. Oligonucleotide sequences used for vector construction

Table 3. Oligonucleotide sequences used for PCR reactions

Table 4. PCR conditions for all reactions

Supplemental material

Movie S4: Melanoblast specific Fucci2a expression in mouse embryonic skin culture.

Download MP4 Video (9.9 MB)

Movie S3: Fucci2a expression in mouse embryonic kidney culture.

Download MP4 Video (5.4 MB)

Movie S2: Fucci2a expression in mouse embryonic lung culture.

Download MP4 Video (5.8 MB)

Movie S1: Stable Flp-Fucci2a 3T3 cells progressing through the cell cycle.

Download MP4 Video (1 MB)