Figures & data
Figure 1. Gene-targeted Cyclin B1 as a novel setup to study checkpoint recovery competence. (A) U2OS or RPE cells were treated with 1 or 5 μM Etoposide for the indicated time periods and subjected to immunoblotting with the indicated antibodies. (C) Untreated control. (B) Representative images of U2OS Cyclin B1-eYFP and RPE Cyclin B1-eYFP cell populations during ongoing Etoposide treatment. Scale bar: 50 μm. (C–F) Equal amounts of U2OS Cyclin B1-eYFP cells (C and E) and RPE Cyclin B1-eYFP cells (D and F) were treated with Etoposide (C and D) or NCS (E and F) at time point 0, and followed by time-lapse microscopy. Average Cyclin B1-eYFP signal was quantified and passage through mitosis was determined. (G) U2OS Cyclin B1-eYFP and RPE Cyclin B1-eYFP cells were treated with 1 μM Etoposide for 5, 10 or 15 h, and subsequently cellular DNA content and eYFP positivity were assessed by flow cytometry.
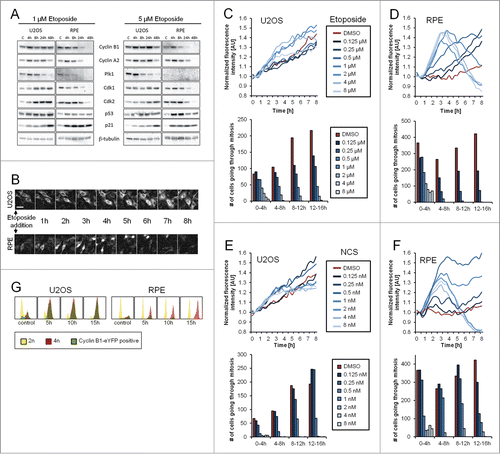
Figure 2. Degradation of Cyclin B1 during ongoing DNA damage is p53-, p21- and APC/CCdh1-dependent. (A) Time-lapse microscopy quantification of populations of RPE and U2OS Cyclin B1-eYFP cells. Cells were treated with 1 μM Etoposide from time point ‘−1 h’. At 0 h cells were treated with MG-132 (inhibitor of the proteasome) or mock treated. (B–D) Time-lapse microscopy quantifications of RPE Cyclin B1-eYFP cells in different conditions. Cells were transfected with the indicated siRNA 48 h and 24 h prior to Etoposide addition. Etoposide was added at a concentration of 1 μM at the ‘−1 h’ time point. At 0 h cells were treated with MG-132, proTAME, or DMSO as indicated. The error bars represent standard error of the mean signal of at least 8 positions.
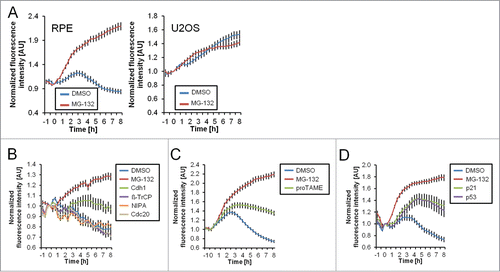
Figure 3. Nuclear translocation is required for Cyclin B1 degradation. (A) Representative images of RPE Cyclin B1-eYFP and U2OS Cyclin B1-eYFP cells during ongoing Etoposide treatment. Scale bar: 20 μm. (B) RPE Cyclin B1-eYFP cells were treated with 1 μM Etoposide and the time between Cyclin B1-eYFP nuclear translocation and onset of degradation was determined for 67 individual cells. The average time ± standard deviation is indicated. (C) RPE Cyclin B1-eYFP cells were treated with 1 μM Etoposide, and Cyclin B1-eYFP nuclear translocation and degradation was assessed for 85 individual cells. (D) RPE Cyclin B1-eYFP cells were transfected with siRNA 48 h and 24 h prior to Etoposide addition, or treated with MG-132 or proTAME as indicated. Intracellular localization of Cyclin B1-eYFP was assessed in single cells at different time points after treatment with 1 μM Etoposide (‘−1 h’ time point). Inhibitors were added at the ‘0 h’ time point. (E) Representative images of U2OS Cyclin B1-eYFP cells treated as indicated. Scale bar: 20 μm. (F) Mitotic entry was assessed for Cyclin B1-eYFP-positive cells treated as in (E). Data are mean and standard deviation of 3 independent experiments. (G) Time-lapse quantification of cells treated as in (E). The error bars represent standard error of the mean signal of at least 8 positions. (H) The time point of nuclear translocation and the onset of degradation of Cyclin B1-eYFP were determined in single U2OS Cyclin B1-eYFP cells. Each line represents a single cell. Inhibitors were added 1 h after Etoposide treatment. (I) Representative images of RPE Cyclin B1-eYFP cells treated with 1 μM Etoposide from time point ‘−1 h’. After 1 h cells were treated as indicated. Scale bar: 20 μm. (J) The time point of nuclear translocation and the onset of degradation of Cyclin B1-eYFP were determined in single RPE Cyclin B1-eYFP cells. Each line represents a single cell. Inhibitors were added 1 h after Etoposide treatment.
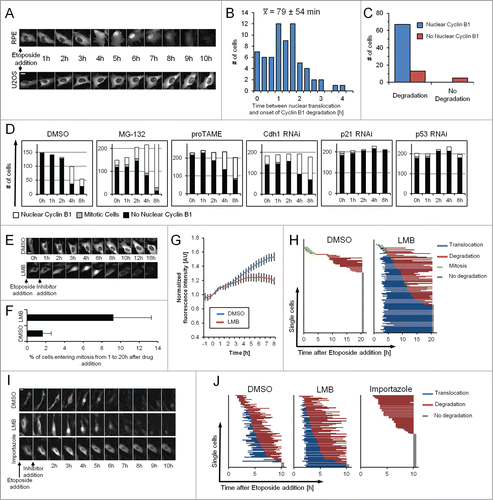
Figure 4. Single RPE cells are not able to recover after Cyclin B1 nuclear translocation. (A) Representative montage of an RPE Cyclin B1-eYFP cell growing on a fibronectin-coated micropattern treated with 1 μM Etoposide for 48 h and followed for an additional 114 h after Etoposide was washed out. Scale bar: 50 μm. (B) RPE Cyclin B1-eYFP cells and U2OS Cyclin B1-eYFP cells were treated for 5, 10 or, 15 h with 1 μM Etoposide or mock treated. Subsequently, damaged cells were forced into mitosis using KU60019 and UCN-01. Nocodazole was added to block cells in mitosis. The percentage of Cyclin B1-eYFP positive cells and the percentage of mitotic cells were determined by flow cytometry. The graphs denote averages of 3 independent experiments. Error bars represent standard errors. (C) Time-lapse microscopy quantifications of RPE Cyclin B1-eYFP cells treated with 1 μM Etoposide at time point 0 and caffeine addition at the indicated time points. The error bars represent standard error of the mean signal of at least 8 positions. (D) The percentage of Cyclin B1-eYFP-positive cells passing through mitosis was assessed from (C). (E) The time point of nuclear translocation and the onset of degradation of Cyclin B1-eYFP were determined in single cells treated as in (C). Each line represents a single cell. The dotted lines indicate presence of caffeine. (F) Representative images of cells in (C) treated with Caffeine. Mitotic cell is marked by asterisk. (G) RPE Cyclin B1-eYFP cells were treated with 1 μM Etoposide and caffeine was added after 4 h. Cyclin B1-eYFP intracellular localization and cell fate was assessed for 96 individual cells.
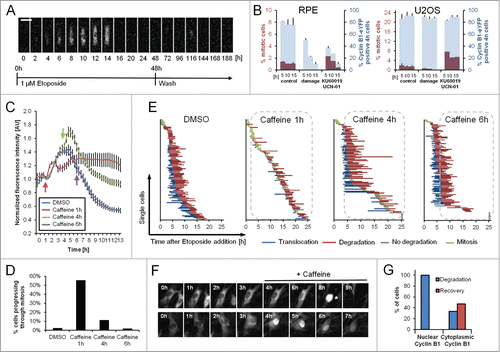
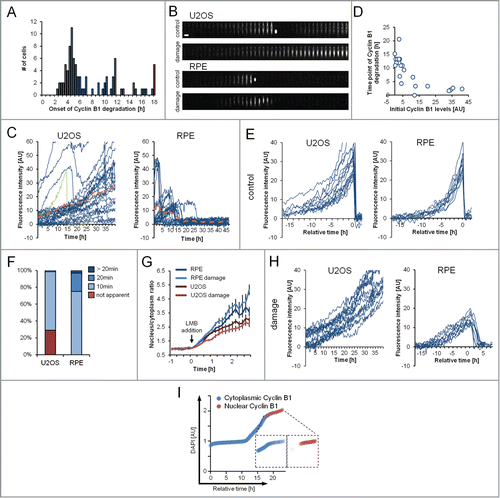
Figure 5. The time point of Cyclin B1 degradation is decoupled from DDR activation. (A) RPE Cyclin B1-eYFP cells were treated with 1 μM Etoposide and the time point of onset of Cyclin B1-eYFP degradation was assessed. The red bar indicates cells that did not initiate degradation during the time of the experiment. (B) Representative montages of single U2OS Cyclin B1-eYFP and RPE Cyclin B1-eYFP cells on fibronectin-coated micropatterns during an unperturbed cell cycle (control) and during treatment with 1 μM Etoposide (damage). Time between images is 1 h. Scale bar: 50 μm. (C) Single-cell quantifications of time-lapse images as in (B) for U2OS Cyclin B1-eYFP cells and RPE Cyclin B1-eYFP cells under treatment with 1 μM Etoposide from time point ‘0 h’. The green track indicates a cell undergoing mitosis. The dashed orange lines denote the average of the displayed cells. (D) RPE Cyclin B1-eYFP cells were grown on fibronectin-coated micropatterns and treated with 1 μM Etoposide. The Cyclin B1-eYFP levels at the time of Etoposide addition are plotted versus the time point of maximum Cyclin B1-eYFP levels (‘time point of Cyclin B1-eYFP degradation’). (E and H) In silico synchronizations of single-cell quantifications as in (C) in unperturbed conditions (E) or under treatment with 1 μM Etoposide (H). Data are from a single experiment in parallel wells, allowing for direct comparison of fluorescence levels. Cells in (E) are synchronized in silico to mitosis. Graphs (H) show tracks of cells with near-background levels at the time of Etoposide addition. RPE Cyclin B1-eYFP cells were synchronized in silico for to the maximum level of Cyclin B1-eYFP reached. (F) The time point of apparent nuclear translocation of Cyclin B1-eYFP before mitosis was assessed in RPE Cyclin B1-eYFP and U2OS Cyclin B1-eYFP cells. (G) Time-lapse microscopy quantifications of the nuclear to cytoplasm ratio of single RPE Cyclin B1-eYFP and U2OS Cyclin B1-eYFP cells. Cells were treated with 1 μM Etoposide or mock treated with DMSO at time point ‘−1 h’. LMB was added at time point ‘0 h’. Mean and standard error of at least 15 cells per condition are depicted. (I) Quantification of DNA content (DAPI) vs. estimated time. Cells were sorted for DAPI levels and the predominant localization of Cyclin B1 was assessed for each cell.