1,758
Views
24
CrossRef citations to date
0
Altmetric
Reports

Autophagy functions on EMT in gastrulation of avian embryo

, , , , , , , , & show all
Pages 2752-2764 | Received 14 Mar 2014, Accepted 16 Jun 2014, Published online: 30 Oct 2014

Figures & data

Figure 1. Autophagy exists in HH4 chick embryo. A-D: Immunofluorescent staining was performed on whole-mount HH4 chick embryo to detect the expression of Atg7. The bright-field images of HH4 chick embryo (A) and the immunofluorescent image of Atg7 expression in the HH4 chick embryo (B). Transverse sections were carried out at the anterior primitive streak (C and C′) and the middle primitive streak (D and D′) levels indicated by the white dotted lines in B. E-G: Atg8 immunofluorescent staining was performed after co-transfected pEGFP-N1 and Atg7. The transfected region was indicated by GFP fluorescence (E) and the Atg8 expression was activated at the corresponding region (F-G, red arrow) compared with the non-transfected region (F, white arrow). H: Primitive streaks were collected for RT-PCR analysis after transfected with Control-GFP, or Atg7 respectively. In the Atg7 transfected embryos, Atg8 expression was promoted compared with Control-GFP embryos (N = 3). Abbreviations: BF, bright-field. Scale bars = 600 μm in A-B, 100 μm in C′-C″, 50 μm in D′-D″, and 20 μm in E-G.
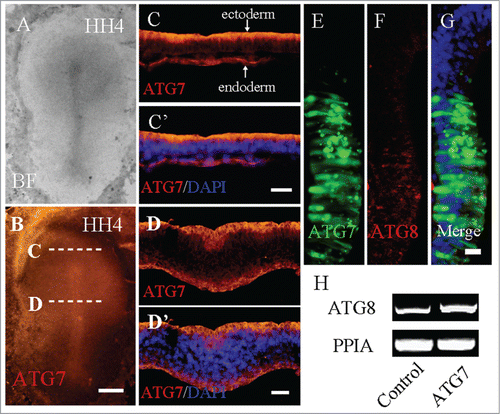
Figure 1. Autophagy exists in HH4 chick embryo. A-D: Immunofluorescent staining was performed on whole-mount HH4 chick embryo to detect the expression of Atg7. The bright-field images of HH4 chick embryo (A) and the immunofluorescent image of Atg7 expression in the HH4 chick embryo (B). Transverse sections were carried out at the anterior primitive streak (C and C′) and the middle primitive streak (D and D′) levels indicated by the white dotted lines in B. E-G: Atg8 immunofluorescent staining was performed after co-transfected pEGFP-N1 and Atg7. The transfected region was indicated by GFP fluorescence (E) and the Atg8 expression was activated at the corresponding region (F-G, red arrow) compared with the non-transfected region (F, white arrow). H: Primitive streaks were collected for RT-PCR analysis after transfected with Control-GFP, or Atg7 respectively. In the Atg7 transfected embryos, Atg8 expression was promoted compared with Control-GFP embryos (N = 3). Abbreviations: BF, bright-field. Scale bars = 600 μm in A-B, 100 μm in C′-C″, 50 μm in D′-D″, and 20 μm in E-G.

Figure 2. Overexpression of Atg7 in epiblast enhanced the expression of E-Cadherin. Atg7 expression was determined using immunofluorescent staining following the electroporation of Atg7-GFP at half-side of HH4 chick embryo. A: The merge image of Atg7-GFP (green) and E-Cadherin immunofluorescent staining (red) in HH4 chick embryo. B: E-Cadherin immunofluorescent staining (red) in HH4 chick embryo. E-Cadherin expression was slightly promoted at the side of Atg7-GFP transfection as indicated by arrow. C′-C″: The transverse sections of transfected embryo at middle primitive streak level as indicated by the white dotted lines in A. C′ is E-Cadherin only; C″ is Atg7-GFP + E-Cadherin staining. D-E: High magnification images from the control side (D) and transfected side (E) as indicated by white line squares in C′ respectively. F: High magnification merge images from the transfected side as indicated by white line squares in C″. G: Western blot (WB) showing the expression of E-cadherin and Atg7 in HCT116 cells, which were transfected with either myc-Atg7 (Atg7-targeted) or myc-vector plasmids (control) respectively. Actin was used as a loading control. Scale bars = 500 μm in A-B and 80 μm in C′- C″ and 15 μm in D, E-E′.
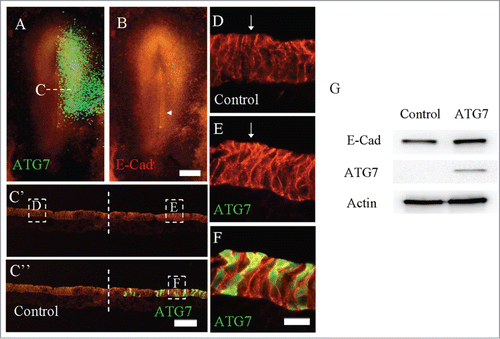
Figure 2. Overexpression of Atg7 in epiblast enhanced the expression of E-Cadherin. Atg7 expression was determined using immunofluorescent staining following the electroporation of Atg7-GFP at half-side of HH4 chick embryo. A: The merge image of Atg7-GFP (green) and E-Cadherin immunofluorescent staining (red) in HH4 chick embryo. B: E-Cadherin immunofluorescent staining (red) in HH4 chick embryo. E-Cadherin expression was slightly promoted at the side of Atg7-GFP transfection as indicated by arrow. C′-C″: The transverse sections of transfected embryo at middle primitive streak level as indicated by the white dotted lines in A. C′ is E-Cadherin only; C″ is Atg7-GFP + E-Cadherin staining. D-E: High magnification images from the control side (D) and transfected side (E) as indicated by white line squares in C′ respectively. F: High magnification merge images from the transfected side as indicated by white line squares in C″. G: Western blot (WB) showing the expression of E-cadherin and Atg7 in HCT116 cells, which were transfected with either myc-Atg7 (Atg7-targeted) or myc-vector plasmids (control) respectively. Actin was used as a loading control. Scale bars = 500 μm in A-B and 80 μm in C′- C″ and 15 μm in D, E-E′.

Figure 3. The Disturbance of autophagy retards chick embryo development. The evaluation of chick embryo development was fulfilled following the treatment of either RAPA or 3-MA compared to control. A-I: The bright-field images of the developing embryos in control group (A-C), RAPA treated group (D-E) or 3-MA treated group (F-I) at 0 hour, 18 hour and 33 hour respectively. J: Bar chart showing the comparison of the length of primary streak in embryos at stage HH4 between the control, RAPA treated and 3-MA treated group. K: Bar chart showing the number of embryos in different stages at 33-hour incubation between the control group, RAPA treatment group and 3-MA treated group. L: Bar charts showing the pairs of somites at 33-hour incubation between the control group, 3-MA treated group and RAPA treated group. ***P < 0.001 indicating highly significant difference between RAPA-or 3-MA-treated and control embryos. Scale bars = 1000 μm in A,D,G, 700 μm in B,E,H, and 600 μm in C,F,I.
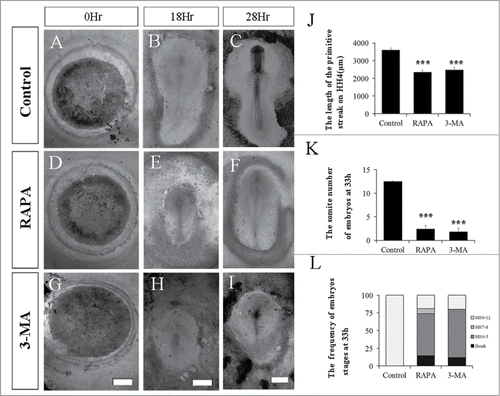
Figure 3. The Disturbance of autophagy retards chick embryo development. The evaluation of chick embryo development was fulfilled following the treatment of either RAPA or 3-MA compared to control. A-I: The bright-field images of the developing embryos in control group (A-C), RAPA treated group (D-E) or 3-MA treated group (F-I) at 0 hour, 18 hour and 33 hour respectively. J: Bar chart showing the comparison of the length of primary streak in embryos at stage HH4 between the control, RAPA treated and 3-MA treated group. K: Bar chart showing the number of embryos in different stages at 33-hour incubation between the control group, RAPA treatment group and 3-MA treated group. L: Bar charts showing the pairs of somites at 33-hour incubation between the control group, 3-MA treated group and RAPA treated group. ***P < 0.001 indicating highly significant difference between RAPA-or 3-MA-treated and control embryos. Scale bars = 1000 μm in A,D,G, 700 μm in B,E,H, and 600 μm in C,F,I.

Figure 4. RAPA treatment promoted the expression of ATG7 and E-Cadherin. Immunofluorescent staining against Atg7 and E-Cadherin were performed on the control and RAPA-treated HH4 chick embryos. A-B: The bright-filed images (A) and Atg7 immunofluorescent images (B) of the embryo respectively treated by RAPA at 33 hour. C-C′: The transverse sections of Atg7 expression (C) and Atg7 expression + DAPI staining (C′) respectively at the level indicated by dotted line C in B panel, the small panel in C′ is control section. D-D′: The transverse sections of Atg7 expression (D) and Atg7 expression + DAPI staining (D′) respectively at the level indicated by dotted line D in B panel, the small panel in D′ is control section. E-E′: E-Cadherin is expressed on the ectoderm cell membrane of control embryo (white arrow in E′); F-F′: E-Cadherin expression level was enhanced on ectoderm cell membrane and ectopic expression in nucleus after RAPA treatment (white arrow in F′). I: Primitive streaks were collected for RT-PCR analysis after being treated with RAPA for 33 h and the control group. In RAPA-treated embryos, E-Cad expression was increased and N-Cad expression was inhibited in comparison with control embryos (N = 20). H: E-Cadherin and N-Cadherin expression levels were detected by real-time PCR. E-Cadherin expression was enhanced and N-Cadherin expression was inhibited in 80 nM RAPA-treated embryos compared to the control. Error bars indicate mean ± s.d. ***P < 0.001 indicating highly significant difference between RAPA-treated and control embryos. I: Western blot shows that the expression of E-Cadherin in HCT116 cells from no RAPA treatment (control), or 100 nM RAPA treatment for 1 hour and 2 hours. Actin was used as a loading control. Scale bars = 600 μm in A-B and 500 μm in C-C′ and 500 μm in D-D′, E-E′.
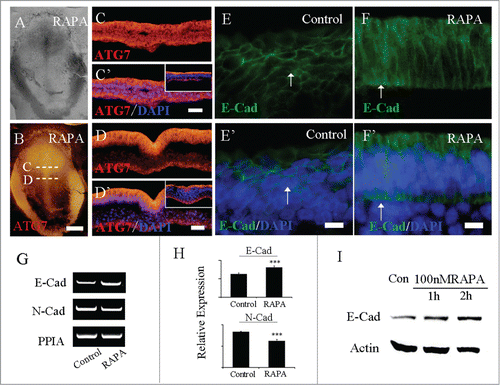
Figure 4. RAPA treatment promoted the expression of ATG7 and E-Cadherin. Immunofluorescent staining against Atg7 and E-Cadherin were performed on the control and RAPA-treated HH4 chick embryos. A-B: The bright-filed images (A) and Atg7 immunofluorescent images (B) of the embryo respectively treated by RAPA at 33 hour. C-C′: The transverse sections of Atg7 expression (C) and Atg7 expression + DAPI staining (C′) respectively at the level indicated by dotted line C in B panel, the small panel in C′ is control section. D-D′: The transverse sections of Atg7 expression (D) and Atg7 expression + DAPI staining (D′) respectively at the level indicated by dotted line D in B panel, the small panel in D′ is control section. E-E′: E-Cadherin is expressed on the ectoderm cell membrane of control embryo (white arrow in E′); F-F′: E-Cadherin expression level was enhanced on ectoderm cell membrane and ectopic expression in nucleus after RAPA treatment (white arrow in F′). I: Primitive streaks were collected for RT-PCR analysis after being treated with RAPA for 33 h and the control group. In RAPA-treated embryos, E-Cad expression was increased and N-Cad expression was inhibited in comparison with control embryos (N = 20). H: E-Cadherin and N-Cadherin expression levels were detected by real-time PCR. E-Cadherin expression was enhanced and N-Cadherin expression was inhibited in 80 nM RAPA-treated embryos compared to the control. Error bars indicate mean ± s.d. ***P < 0.001 indicating highly significant difference between RAPA-treated and control embryos. I: Western blot shows that the expression of E-Cadherin in HCT116 cells from no RAPA treatment (control), or 100 nM RAPA treatment for 1 hour and 2 hours. Actin was used as a loading control. Scale bars = 600 μm in A-B and 500 μm in C-C′ and 500 μm in D-D′, E-E′.

Figure 5. 3-MA treatment leads to the alteration of adhension molecule expression in gastrula embryo. Immunofluorescent staining against Atg7, E-Cadherin and Laminin were performed on the control and 3-MA-treated HH5 chick embryos, so did the RT-PCR assay of N-Cadherin expression. (A and B) The bright-filed images (A) and Atg7 immunofluorescent images (B) of the embryo respectively treated by 3-MA at 33 hour. C-C′: The transverse sections of Atg7 expression (C) and Atg7 expression + DAPI staining (C′) respectively at the level indicated by dotted line C in B panel, the small panel in C′ is control section. D-D′: The transverse sections of Atg7 expression (D) and Atg7 expression + DAPI staining (D′) respectively at the level indicated by dotted line D in B panel, the small panel in D′ is control section. (E and G) Immunofluorescent staining against E-Cadherin on the whole-mount control (E) and 3-MA-treated (G) HH4 chick embryos respectively. F, F′: The transverse sections at the level at the middle primitive streak as indicated by white dotted line in E. F is the E-Cadherin only; F′ is the E-Cadherin + DAPI staining. H, H′: The transverse sections at the level at the middle primitive streak as indicated by white dotted line in G. H is the E-Cadherin only; H′ is the E-Cadherin + DAPI staining. (I and K) Immunofluorescent staining against laminin on the whole-mount control (I) and 3-MA-treated (K) HH4 chick embryos respectively. J, J′: The transverse sections at the level at the middle primitive streak as indicated by white dotted line in I. J is the laminin only; J′ is the Laminin + DAPI staining. L, L′: The transverse sections at the level at the middle primitive streak as indicated by white dotted line in K. L is the Laminin only; L′ is the Laminin + DAPI staining. (M) RT-PCR showing Atg8 and N-Cadherin expression in the control and 3-MA-treated embryos. Abbreviations: E-Cad, E-Cadherin; N-Cad, N-Cadherin. Scale bars = 500 μm in A and B, 70 μm in C and C′, 40 μm in D and D′, 500 μm in E and G, 30 μm in F and F′, 600 μm in I and K and 30 μm in H and H′.
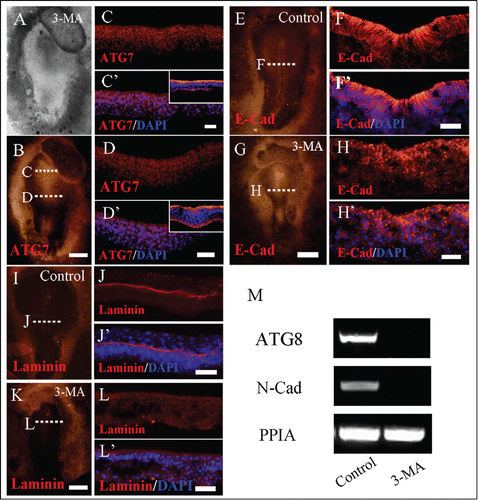
Figure 5. 3-MA treatment leads to the alteration of adhension molecule expression in gastrula embryo. Immunofluorescent staining against Atg7, E-Cadherin and Laminin were performed on the control and 3-MA-treated HH5 chick embryos, so did the RT-PCR assay of N-Cadherin expression. (A and B) The bright-filed images (A) and Atg7 immunofluorescent images (B) of the embryo respectively treated by 3-MA at 33 hour. C-C′: The transverse sections of Atg7 expression (C) and Atg7 expression + DAPI staining (C′) respectively at the level indicated by dotted line C in B panel, the small panel in C′ is control section. D-D′: The transverse sections of Atg7 expression (D) and Atg7 expression + DAPI staining (D′) respectively at the level indicated by dotted line D in B panel, the small panel in D′ is control section. (E and G) Immunofluorescent staining against E-Cadherin on the whole-mount control (E) and 3-MA-treated (G) HH4 chick embryos respectively. F, F′: The transverse sections at the level at the middle primitive streak as indicated by white dotted line in E. F is the E-Cadherin only; F′ is the E-Cadherin + DAPI staining. H, H′: The transverse sections at the level at the middle primitive streak as indicated by white dotted line in G. H is the E-Cadherin only; H′ is the E-Cadherin + DAPI staining. (I and K) Immunofluorescent staining against laminin on the whole-mount control (I) and 3-MA-treated (K) HH4 chick embryos respectively. J, J′: The transverse sections at the level at the middle primitive streak as indicated by white dotted line in I. J is the laminin only; J′ is the Laminin + DAPI staining. L, L′: The transverse sections at the level at the middle primitive streak as indicated by white dotted line in K. L is the Laminin only; L′ is the Laminin + DAPI staining. (M) RT-PCR showing Atg8 and N-Cadherin expression in the control and 3-MA-treated embryos. Abbreviations: E-Cad, E-Cadherin; N-Cad, N-Cadherin. Scale bars = 500 μm in A and B, 70 μm in C and C′, 40 μm in D and D′, 500 μm in E and G, 30 μm in F and F′, 600 μm in I and K and 30 μm in H and H′.

Figure 6. Detecting EMT-related gene expression in gastrulating embryos following 3-MA treatment using in situ hybridization. Whole-mount chick embryo in situ hybridization of Slug, FGF8, Shh and chordin were carried out following 3-MA treatment. Western blotting for RhoA, Msx1 and Slug expression was performed as well. (A and B) Slug in situ hybridization in control (A) and 3-MA-treated (B) HH4 embryo respectively. (C–E) FGF8 in situ hybridization in control HH4 embryo (C), control HH6 embryo (D) and 3-MA-treated HH4 embryo (E) respectively. C′-C″: The transverse sections at the levels indicated by dotted lines in C respectively. D-D: The transverse sections at the levels indicated by dotted lines in D respectively. E′-E″: The transverse sections at the levels indicated by dotted lines in E respectively. (F and G) Shh in situ hybridization in control (F) and 3-MA-treated (G) HH5 embryo respectively. F′-F″: The transverse sections at the levels indicated by dotted lines in F respectively. G′-G″: The transverse sections at the levels indicated by dotted lines in G respectively. (H and I) Chordin in situ hybridization in control (H) and 3-MA-treated (I) HH4 embryo respectively. (J) Semi-quantitative RT-PCR was performed for detecting the expression of RhoA, Rac1, Cdc42, Msx1 and Slug in the control and 3-MA-treated embryos. Abbreviations: HN, Hensen's node; NT, neural tube; PS, primitive streak. Scale bars = 900 μm in A and B, 500 μm in C–E, 40 μm in C′ and C″, 40 μm in D′ and D″, 40 μm in E′ and E″, 800 μm in F and G, 40 μm in F′ and G′, 40 μm in F″ and G″ and 600 μm in H and I.
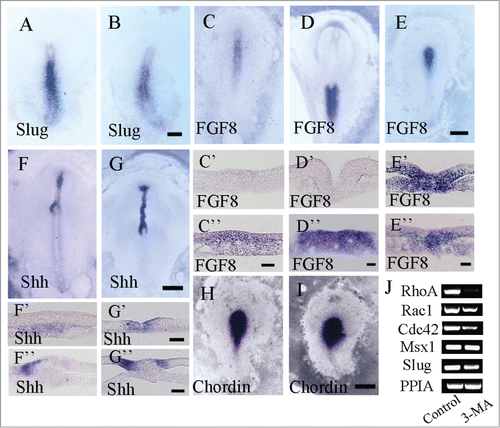
Figure 6. Detecting EMT-related gene expression in gastrulating embryos following 3-MA treatment using in situ hybridization. Whole-mount chick embryo in situ hybridization of Slug, FGF8, Shh and chordin were carried out following 3-MA treatment. Western blotting for RhoA, Msx1 and Slug expression was performed as well. (A and B) Slug in situ hybridization in control (A) and 3-MA-treated (B) HH4 embryo respectively. (C–E) FGF8 in situ hybridization in control HH4 embryo (C), control HH6 embryo (D) and 3-MA-treated HH4 embryo (E) respectively. C′-C″: The transverse sections at the levels indicated by dotted lines in C respectively. D′-D″: The transverse sections at the levels indicated by dotted lines in D respectively. E′-E″: The transverse sections at the levels indicated by dotted lines in E respectively. (F and G) Shh in situ hybridization in control (F) and 3-MA-treated (G) HH5 embryo respectively. F′-F″: The transverse sections at the levels indicated by dotted lines in F respectively. G′-G″: The transverse sections at the levels indicated by dotted lines in G respectively. (H and I) Chordin in situ hybridization in control (H) and 3-MA-treated (I) HH4 embryo respectively. (J) Semi-quantitative RT-PCR was performed for detecting the expression of RhoA, Rac1, Cdc42, Msx1 and Slug in the control and 3-MA-treated embryos. Abbreviations: HN, Hensen's node; NT, neural tube; PS, primitive streak. Scale bars = 900 μm in A and B, 500 μm in C–E, 40 μm in C′ and C″, 40 μm in D′ and D″, 40 μm in E′ and E″, 800 μm in F and G, 40 μm in F′ and G′, 40 μm in F″ and G″ and 600 μm in H and I.

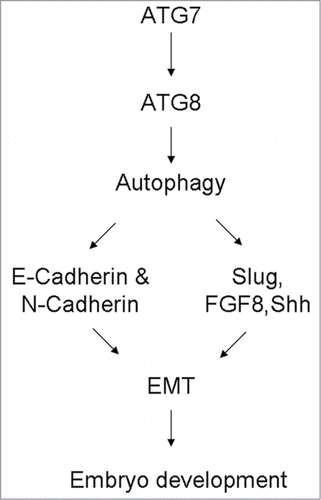
Figure 7. A proposed model depicting the possible mechanisms involved in EMT defect in gastrulating embryos induced by Atg7-dependent autophagy.

Figure 7. A proposed model depicting the possible mechanisms involved in EMT defect in gastrulating embryos induced by Atg7-dependent autophagy.

Reprints and Corporate Permissions

Please note: Selecting permissions does not provide access to the full text of the article, please see our help page How do I view content?

To request a reprint or corporate permissions for this article, please click on the relevant link below:

Academic Permissions

Please note: Selecting permissions does not provide access to the full text of the article, please see our help page How do I view content?

Obtain permissions instantly via Rightslink by clicking on the button below:

If you are unable to obtain permissions via Rightslink, please complete and submit this Permissions form. For more information, please visit our Permissions help page.