Figures & data
Figure 1 (See previous page). Autophagic flux of paired melanoma cell lines and cellular response to growth conditions. (A) Representative electron micrographs and box plots of mean AV/cell for WM793 and 1205Lu cells (n = 35) grown in complete medium in 2-dimensional cell culture; *P < 0.05 based on the Mann-Whitney test. Red arrows indicate intracellular autophagosomes. Scale bars = 2 μm. (B) Representative fluorescent images (60X) of mCherry-eGFP-LC3 infected 1205Lu and WM793 cells. Red puncta represent mCherry-positive structures that reflect active fusion of autophagosomes with functional lysosomes (red arrows). Scale bars = 50 μm. *P < 0.05 using the Student t test. (C) LC3 immunoblotting of WM793 and 1205Lu melanoma cells grown in media supplemented with either 10% or 1% FBS. (D) Schematic of 3D cell culture spheroid model illustrating secretome sample acquisition from the overlaying media and interstitial fluid (media in the collagen matrix) compartments. (E) Live/Dead Assay in 3-dimensional spheroids grown in a collagen matrix after exposure for 24 h to either serum-free media or media with 1% FBS. Green (live), calcein AM; red (dead), propidium iodide.
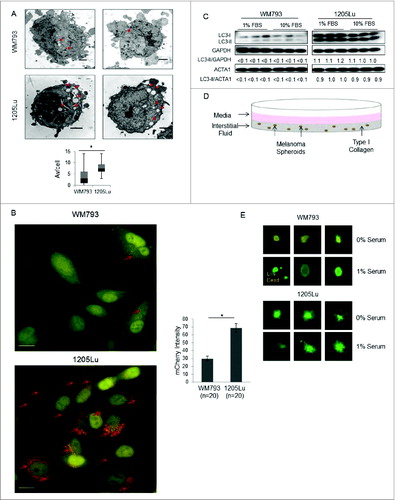
Figure 2. Characterization of differentially secreted proteins by low- and high-autophagy melanoma cells. (A) Distribution of significantly elevated proteins (fold2- or greater) in either 1205Lu or WM793. (B) Classification of differentially secreted proteins by GO terms for cellular component using STRAP. Proteins may be assigned to multiple cellular component categories; percentages are computed as fraction of total assignments. (C) Classification of differentially secreted proteins by GO terms for biological process. Proteins may be assigned in multiple biological process categories; percentages are computed as fraction of total assignments. (D) Top-ranking subnetwork identified by shortest paths analysis and betweenness-centrality clustering based on functional relations from STRING. (E) Second-ranked functional subnetwork. Nodes colored in red are differentially secreted proteins identified in our study.
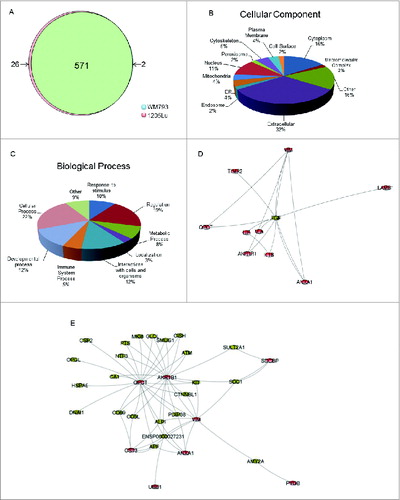
Figure 3. Measurement of candidate biomarkers of high autophagy in a panel of high- and low-autophagy melanoma cell lines in monolayer culture. (A) left panel – An exposure from a single LC3 immunoblot of total cell lysates for biological duplicates of WM9, WM1346, WM1361A, WM164, WM1366, and A375 melanoma cell lines; right panel – densitometric quantification of protein gel blots. P values were calculated using ANOVA (*P < 0.05). (B) Sandwich ELISA assays of candidate biomarkers in melanoma cell line conditioned media from cell lines in 2D culture with high (1205Lu, WM9, WM1361A, and WM1346) or low (WM793, WM1366, WM164, A375) basal autophagic flux. Selected candidate biomarkers in conditioned media for 1205Lu and WM793 grown in 3D culture are shown for comparison. P values were calculated using the Welch t test (N = 8; *P < 0.05, **P < 0.01). Error bars represent standard errors.
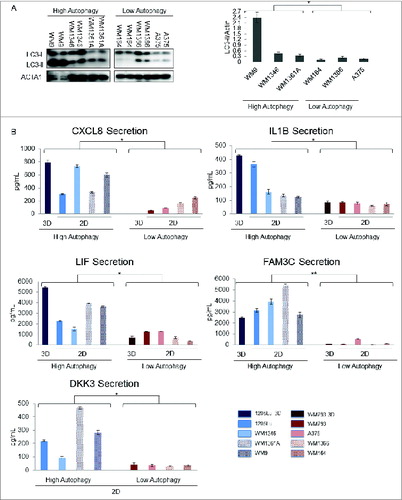
Figure 4. Measurement of candidate biomarkers of high autophagy in Tat-BECN1-treated melanoma cells. (A) An exposure from a single immunoblot characterizing LC3 in WM793 cells treated with either Tat-BECN1, Tat-Scrambled, or Opti-HCl (see Materials and Methods) medium only (‘no peptide’) in biological duplicates. Parental refers to untreated cells maintained in RPMI-1640 and 1% FBS and all others contain Opti-HCl. (B) Sandwich ELISA assay results for IL1B, CXCL8, LIF, FAM3C, and DKK3 in conditioned medium of WM793 cells treated with either Tat-BECN1, Tat-Scrambled control, or no peptide. For the 20-μM experiment, after 3 h exposure to the indicated peptide, conditioned media was removed and fresh media without peptide (−) was added for another 3 h (+3). Error bars denote SD, and P values were calculated using the Student t test (N = 3 per treatment group) (*P < 0.05, **P < 0.01).
Figure 5. Measurement of candidate autophagy biomarkers in a high-autophagy melanoma cell line with siRNA-induced ATG7 silencing. Levels of CXCL8, IL1B, LIF, DKK3, and FAM3C were measured by sandwich ELISA in the conditioned media of control- and mock-transfected WM1346 high-autophagy melanoma cells vs. ATG7-silenced cells 96 h post-transfection (72 h to allow for sufficient transfection followed by a media change and another 24-h incubation to collect conditioned medium for biomarker evaluation). Error bars denote SD, and P values were calculated by ANOVA (*P < 0.05, **P < 0.01).
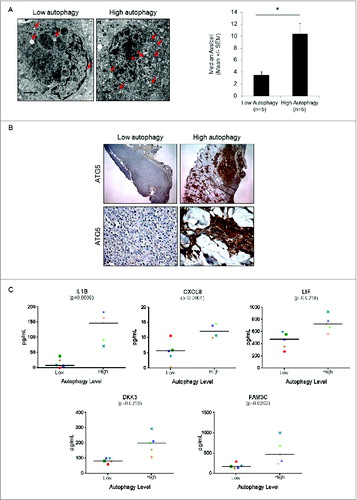
Figure 6. Measurement of autophagy candidate biomarkers in the serum of melanoma patients whose tumors have high or low autophagy. (A) Representative electron micrographs (left panels) and vesicle counts from patients with low- and high-autophagy melanoma tumors (right panel). Red arrows indicate tumor cell autophagic vacuoles. Scale bars = 2 μm. (B) Representative immunohistochemical staining of ATG5 (5X top, 40X bottom) in melanoma tumors from a patient with low and a patient with high tumor autophagy. (C) Measurement of CXCL8, IL1B, LIF, DKK3, and FAM3C by ELISA in serum of melanoma patients with either high or low levels of autophagy. Mean values are indicated by a horizontal line. P values were calculated using the Welch t test (N = 5 per group).