Figures & data
Table 1. The data sources of the Autophagy Regulatory Network
Table 2. Basic statistics of the Autophagy Regulatory Network
Figure 1. Connections between autophagy components and signaling proteins in one, 2 or 3 steps. One-step connections are direct protein-protein interactions (PPIs), or a pathway member TF regulates the transcription of an autophagy protein. Two-step connections also can include PPIs and TF-gene interactions, but TF-miRNA-mRNA interactions as well. Three-step interactions are combinations of all these types of interactions, involving 4 molecular species. In this representation, signal is coming from the signaling pathway receptors binding ligands, toward the proteins executing autophagy. By analyzing the whole network, feedback circuits and network motifs can be identified along the paths.
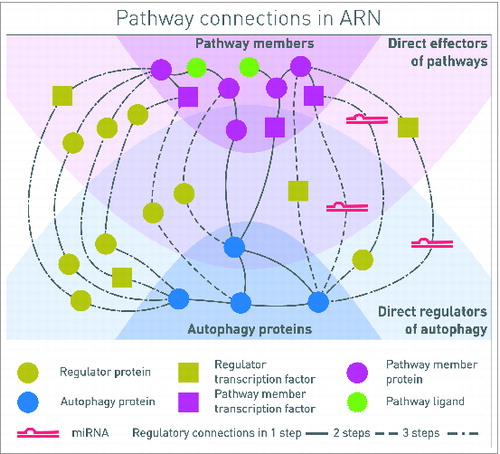
Figure 2. Basic statistics of ARN. Number of components (A) and interactions (B) in different layers of ARN is shown. The numbers of experimentally verified interactions are indicated in parenthesis next to the total number of interactions, which also includes predicted ones.
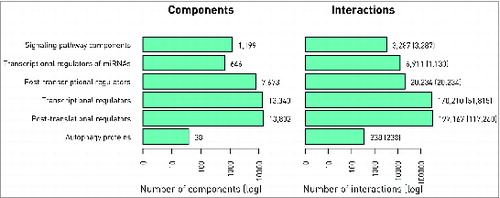
Figure 3. Screenshots from the protein datasheet of BECN1 from the ARN webpage. (A) At the top of the datasheet the name, gene name, UniProt ID, and Ensembl protein ID of the selected protein is shown, with hyperlinks to the UniProt and Ensembl webpages. Below this box, the potential signaling properties and disease related information with a special highlight on cancer types is listed. (B) The interactions of the selected protein are listed, grouped by layers. In addition, at the bottom of the list, the pathway connections can be browsed by pathways. (C) Information on sources, references and confidence scores of each interaction can be obtained by clicking on the green triangles. (D) On the right side of the datasheet, an interactive network image of the first neighbors of the selected proteins is available. Note that unlike ULK1, ULK2 is not present in the BECN1 network as ARN contains only those interactions that were specifically identified between exact proteins, and no publications were curated that experimentally verified the likely connection between ULK2 and BECN1.
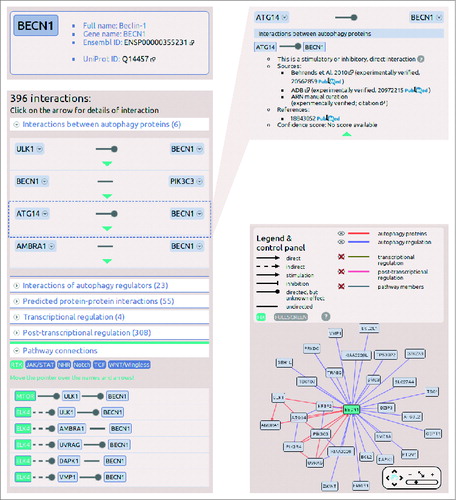
Figure 4. The network of 7 signaling pathways with direct autophagy regulators and core autophagy proteins. The numbers represent the total number of components in each section but for clarity, only components with the highest confidence, one- or 2- step long connections are shown on this figure. We also omitted the connections through transcription factors or miRNAs. Edges between autophagy proteins are blue. Intermediate components (i.e., direct autophagy regulators) in the 2-step connections and their edges are colored with black. Pathways are color-coded, multipathway proteins and edges between different pathways have the colors of the involved pathways mixed. Edges directly connecting pathways and autophagy proteins have the color of the source pathway.
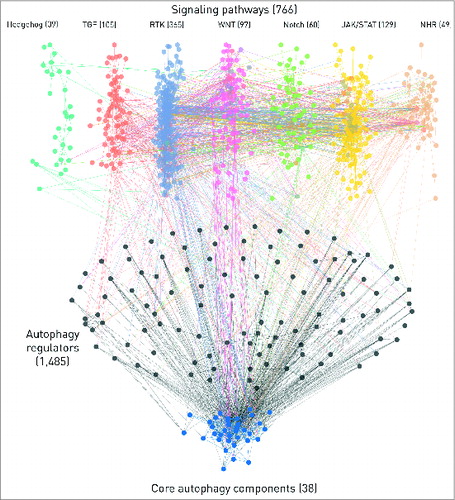
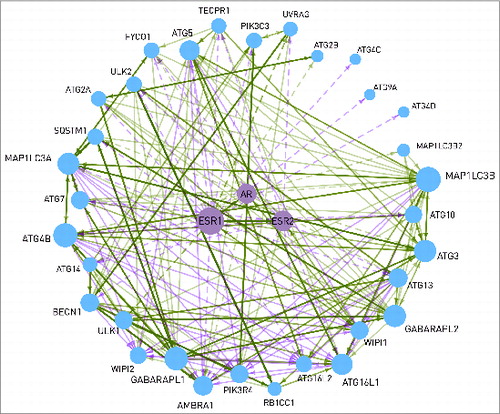
Figure 5. Interactions between the 2 estrogen receptors (ESR1 and ESR2), the androgen receptor (AR), and 32 autophagy proteins. Dashed line represents transcriptional regulation, while continuous line is for post-translational regulation. The width of the lines shows the number of data sources where the interaction can be found. The size of a node is proportional with the number of its connections. WIPI1 is able to bind to the estrogen receptors. AR and ESR2 are able to heterodimerize with ESR1. The interactions between the autophagy proteins are shown with a continuous line.