Figures & data
Figure 1. Inhibition of HMGB1 expression and cytoplasmic translocation enhance TNFSF10-mediated cell death. (A) The indicated HMGB1 wild-type (control shRNA) and knockdown (HMGB1 shRNA) cells were treated with TNFSF10 (1 to 1000 ng/ml) for 24 h, and then cell viability was assayed with the CCK-8 kit (n = 3 , *, P < 0.05). Western blot analysis of the expression of HMGB1 is shown in the inserts. (B) PANC-1 and Jurkat cells were treated with TNFSF10 (100 ng/ml) for 24 h and then cytosolic (Cyt) and nuclear (Nuc) HMGB1 were assayed by western blot. Relative band intensities of cytosolic HMGB1 were quantified and normalized to actin expression (P < 0.05). AU, arbitrary unit. (C and D) PANC-1 cells were treated with TNFSF10 (100 ng/ml) in the absence or presence of indicated ethyl pyruvate (EP) for 24 h. Cytosolic (Cyt) HMGB1 (C) was assayed by western blot and cell viability (D) was assayed by CCK-8 kit (n = 3 , *, P < 0.05). AU, arbitrary unit.
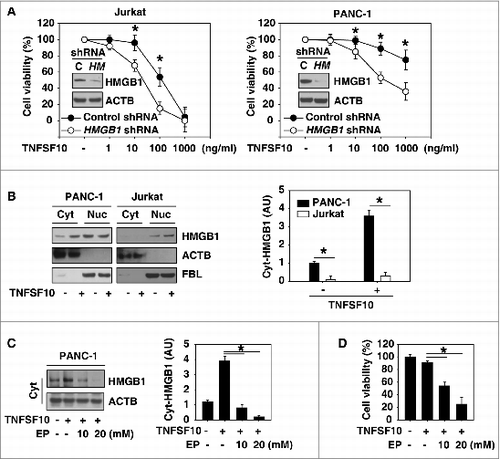
Figure 2. PARP1 is required for TNFSF10-induced poly-ADP-ribosylation and subsequent cytoplasmic translocation of HMGB1. (A) PANC-1 and Jurkat cells were treated with TNFSF10 (100 ng/ml) for 8 to 24 h. Samples were pulled down with anti-HMGB1 and immunoblotted with anti-PARylation and anti-HMGB1 antibodies. Relative band intensities of HMGB1 PARylation were quantified (*, P < 0.05 versus untreated group). (B) PANC-1 cells were transfected with control shRNA and PARP1 shRNA for 48 h and then treated with TNFSF10 (100 ng/ml) for 24 h. The levels of HMGB1 PARylation and cytoplasmic HMGB1 were assayed (*, P < 0.05). AU, arbitrary unit. (C) PANC-1 cells were treated with TNFSF10 (100 ng/ml) in the absence or presence of PJ-34 (20 μM) for 24 h. The levels of HMGB1 PARylation and cytoplasmic HMGB1 were assayed (*, P < 0.05). AU=arbitrary unit. (D–G) Knockdown of FADD and CASP8 by shRNA (D) increased TNFSF10 (100 ng/ml)-induced PARP1 activity (E), HMGB1 PARylation (F), and HMGB1 cytosolic translocation (G) in PANC-1 cells. In contrast, necrostatin-1 (10 μM), a specific inhibitor of RIPK1, inhibits this process. AU, arbitrary unit.
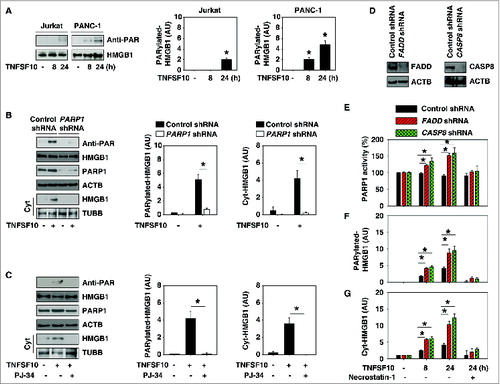
Figure 3. PARP1 promotes TNFSF10-induced autophagy by sustaining formation of the HMGB1-BECN1 complex. (A) PANC-1 cells were transfected with control shRNA and PARP1 shRNA for 48 h and then treated with TNFSF10 (100 ng/ml) for 24 h. The levels of MAP1LC3A-I/II and SQSTM1 were assayed by western blot. Relative band intensities of MAP1LC3A-II and SQSTM1 were quantified (P < 0.05). AU, arbitrary unit. (B and C) The indicated PANC-1 cells were treated with TNFSF10 (100 ng/ml) for 24 h. The number of MAP1LC3A puncta (yellow arrows) (B) was assayed by confocal microscopic analysis (* P < 0.05 vs. control shRNA group; bar = 10 μm). The interaction between HMGB1 and BECN1 (C) was assayed by coimmunoprecipitation analysis. (D) PANC-1 cells were transfected with wild-type and HMGB1C106S cDNA for 48 h and then treated with TNFSF10 (100 ng/ml) for 24 h. The levels of indicated proteins were assayed by western blot. (E) PANC-1 cells were transfected with the indicated control shRNA, PARP1 shRNA, and HMGB1C106S cDNA for 48 h and then treated with TNFSF10 (100 ng/ml) for 24 h. The levels of the indicated proteins were assayed by western blot. Relative band intensities of MAP1LC3A-II and cyt-HMGB1 were quantified. In parallel, cell viability was assayed (n = 3 , * P < 0.05). (F) PANC-1 cells were transfected with wild-type and HMGB1[3KA] cDNA for 48 h and then treated with TNFSF10 (100 ng/ml) for 24 h. The levels of indicated proteins were assayed by western blot.
![Figure 3. PARP1 promotes TNFSF10-induced autophagy by sustaining formation of the HMGB1-BECN1 complex. (A) PANC-1 cells were transfected with control shRNA and PARP1 shRNA for 48 h and then treated with TNFSF10 (100 ng/ml) for 24 h. The levels of MAP1LC3A-I/II and SQSTM1 were assayed by western blot. Relative band intensities of MAP1LC3A-II and SQSTM1 were quantified (P < 0.05). AU, arbitrary unit. (B and C) The indicated PANC-1 cells were treated with TNFSF10 (100 ng/ml) for 24 h. The number of MAP1LC3A puncta (yellow arrows) (B) was assayed by confocal microscopic analysis (* P < 0.05 vs. control shRNA group; bar = 10 μm). The interaction between HMGB1 and BECN1 (C) was assayed by coimmunoprecipitation analysis. (D) PANC-1 cells were transfected with wild-type and HMGB1C106S cDNA for 48 h and then treated with TNFSF10 (100 ng/ml) for 24 h. The levels of indicated proteins were assayed by western blot. (E) PANC-1 cells were transfected with the indicated control shRNA, PARP1 shRNA, and HMGB1C106S cDNA for 48 h and then treated with TNFSF10 (100 ng/ml) for 24 h. The levels of the indicated proteins were assayed by western blot. Relative band intensities of MAP1LC3A-II and cyt-HMGB1 were quantified. In parallel, cell viability was assayed (n = 3 , * P < 0.05). (F) PANC-1 cells were transfected with wild-type and HMGB1[3KA] cDNA for 48 h and then treated with TNFSF10 (100 ng/ml) for 24 h. The levels of indicated proteins were assayed by western blot.](/cms/asset/39d49ad3-18ef-46fb-8dac-ca1d9e60e34b/kaup_a_994400_f0003_c.jpg)
Figure 4. PARP1-mediated autophagy plays a cytoprotective role in TNFSF10-mediated apoptosis. (A–C) The indicated PANC-1 cells, mouse primary lung fibroblasts, and pancreatic acinar cells were treated with TNFSF10 (100 ng/ml) with or without PARP1 inhibitor PJ-34 for 24 h. CASP8 activity (A and B) was assayed by CASP8 Assay Kit (n = 3 , * P < 0.05 versus control shRNA group). In parallel, apoptosis was assayed by flow cytometry (n = 3 , * P < 0.05) and the cleaved CASP8 (C) was assayed by western blot. (D) The indicated PANC-1 cells were treated with TNFSF10 (100 ng/ml) with or without CASP8 inhibitor Z-IETD-FMK (20 μM) for 8 and 24 h. The apoptosis was assayed by flow cytometry (n = 3 , * P < 0.05). (E) HeLa and MCF7 cells were transfected with the indicated shRNA for 48 h and then treated with TNFSF10 (100 ng/ml) for 24 h. The apoptosis was assayed by flow cytometry (n = 3 , * P < 0.05 vs. control shRNA group). (F) Mouse primary lung fibroblasts were transfected with lentivirus-mediated control shRNA and Hmgb1 shRNA for 48 h and then treated with TNFSF10 (100 ng/ml) and PJ-34 (40 μM) for 24 h. Cell viability was assayed with the CCK-8 kit. (G) PANC-1 cells with HMGB1-knockdown were transfected with HMGB1C23S, HMGB1C45S, and HMGB1C106S cDNA for 48 h and then treated with TNFSF10 (100 ng/ml) for 24 h. The interaction between HMGB1 (GFP) and BECN1 was assayed by immunoprecipitation (IP). (H) Indicated PANC-1 cells were transfected with HMGB1C23S and HMGB1C106S cDNA for 48 h and then treated with TNFSF10 (100 ng/ml) for 24 h. The levels of the indicated proteins were assayed by western blot.
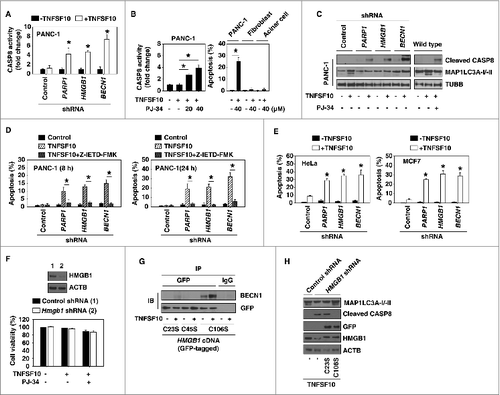
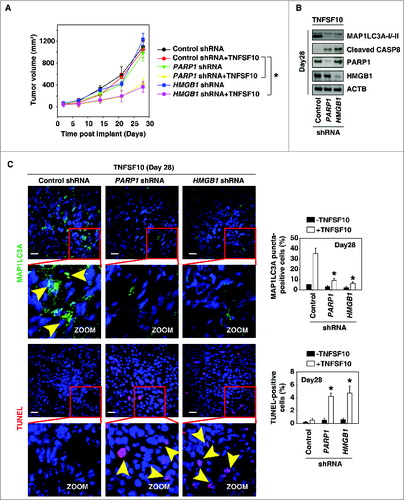
Figure 5. Suppression of the PARP1-HMGB1 pathway increases sensitivity to TNFSF10 in vivo. (A) Pancreatic tumor cells with PARP1 and HMGB1 knockdown are more sensitive to TNFSF10 in vivo. SCID mice were injected subcutaneously with indicated human pancreas cancer PANC-1 cells (2 × 10⁶ cells/mouse) and treated with TNFSF10 (10 mg/kg/ i.v. twice daily) at d 7 for 2 wk. Tumor volume was calculated weekly. Data represent mean ± SE (n = 5 to 8 mice/group, * P < 0.05). (B) Western blot analysis of the indicated protein expression in isolated tumor at d 28 in TNFSF10 treatment group. (C) Autophagy was assayed by MAP1LC3A staining and apoptosis was assayed by TUNEL staining in isolated tumor atd 28. Yellow arrows show MAP1LC3A punctate and TUNEL positive cells, respectively. Quantifications of MAP1LC3A- and TUNEL-positive tumor cells were performed in the tumor sections (n=5 mice/group, * P < 0.05 versus control shRNA group; bar: 30 μm).