3,731
Views
44
CrossRef citations to date
0
Altmetric
Research Paper

Using RNA sequencing for identifying gene imprinting and random monoallelic expression in human placenta

, , , , , , , , , , , , , , & show all
Pages 1397-1409 | Received 12 May 2014, Accepted 22 Aug 2014, Published online: 01 Dec 2014

Figures & data

Figure 1. Schematic view to identify imprinted and monoallelically expressed genes. The pipeline shows the steps involved in analyzing and detecting imprinted and monoallelically expressed genes using RNA-Seq data and R scripts. Arrows show the data flow. Data sources (including RNA-Seq, SNP array data and external sources) are labeled by light gray boxes, while dark gray box shows the final result about imprinted and monoallelically expressed genes. UCSC: University of California Santa Cruz database.Citation17
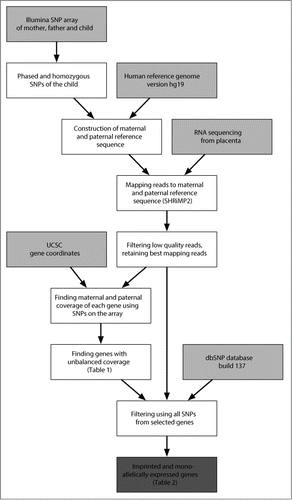
Figure 1. Schematic view to identify imprinted and monoallelically expressed genes. The pipeline shows the steps involved in analyzing and detecting imprinted and monoallelically expressed genes using RNA-Seq data and R scripts. Arrows show the data flow. Data sources (including RNA-Seq, SNP array data and external sources) are labeled by light gray boxes, while dark gray box shows the final result about imprinted and monoallelically expressed genes. UCSC: University of California Santa Cruz database.Citation17

Table 1. Candidate imprinted genes after RNA-Seq and exome genotyping

Table 2. Imprinted and monoallelically expressed genes found in the current study

Table 3. Summary of detected imprinted and monoallelically expressed genes

Figure 2. Allele-specific expression in different placental samples. Each grid shows the allele-specific expression for each of the 12 imprinted and monoallelically expressed genes in different placental samples. The X-axis is the genomic position of the SNP and the Y-axis shows the percentage of maternal reads, with 100% refers to complete maternal expression, 0% corresponds to complete paternal expression and 50% refers to perfect biallelic expression. Statistically significant results are shown in red (maternal expression) and blue (paternal expression). From all non-significant results (depicted in black), only those are shown where the total number of RNA-Seq reads was at least 10. P001 - P014 are family trios analyzed.

Figure 2. Allele-specific expression in different placental samples. Each grid shows the allele-specific expression for each of the 12 imprinted and monoallelically expressed genes in different placental samples. The X-axis is the genomic position of the SNP and the Y-axis shows the percentage of maternal reads, with 100% refers to complete maternal expression, 0% corresponds to complete paternal expression and 50% refers to perfect biallelic expression. Statistically significant results are shown in red (maternal expression) and blue (paternal expression). From all non-significant results (depicted in black), only those are shown where the total number of RNA-Seq reads was at least 10. P001 - P014 are family trios analyzed.

Figure 3. Density curve for gene expression. Red lines show the distribution of expression levels for all 12 imprinted and monoallelically expressed genes detected in the current study (see for details). Median expression of all genes is normalized to 1 (blue line).
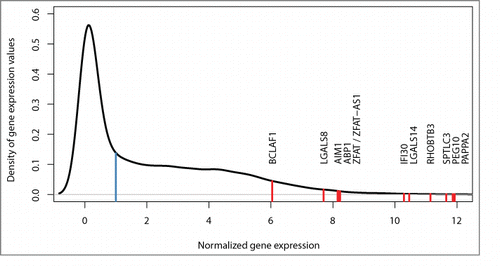
Figure 3. Density curve for gene expression. Red lines show the distribution of expression levels for all 12 imprinted and monoallelically expressed genes detected in the current study (see Table 2 for details). Median expression of all genes is normalized to 1 (blue line).

Figure 4. Genome visualization of the imprinted and monoallelically expressed genes. Previously reported placental imprinted genes are in black (Table S1), candidate imprinted genes are marked in blue () and imprinted and monoallelically expressed genes found in our analysis are marked in red (). This image was generated using Idiographica web service.Citation49
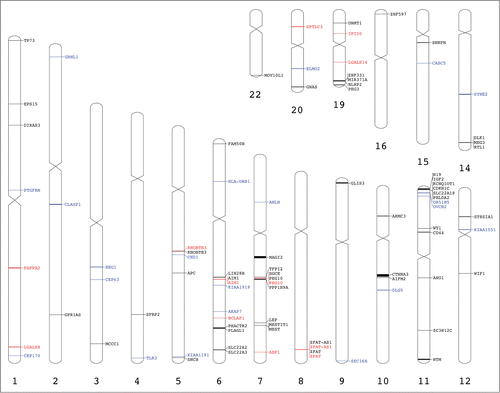
Figure 4. Genome visualization of the imprinted and monoallelically expressed genes. Previously reported placental imprinted genes are in black (Table S1), candidate imprinted genes are marked in blue (Table 1) and imprinted and monoallelically expressed genes found in our analysis are marked in red (Table 2). This image was generated using Idiographica web service.Citation49
Supplemental material

Supplementary_Tables_S1-S4.docx

Download MS Word (156.9 KB)

Supplementary_Figures_S1-S6.docx

Download MS Word (1.2 MB)

Reprints and Corporate Permissions

Please note: Selecting permissions does not provide access to the full text of the article, please see our help page How do I view content?

To request a reprint or corporate permissions for this article, please click on the relevant link below:

Academic Permissions

Please note: Selecting permissions does not provide access to the full text of the article, please see our help page How do I view content?

Obtain permissions instantly via Rightslink by clicking on the button below:

If you are unable to obtain permissions via Rightslink, please complete and submit this Permissions form. For more information, please visit our Permissions help page.