2,002
Views
120
CrossRef citations to date
0
Altmetric
RESEARCH PAPER

Dysregulated Class I histone deacetylases are indicators of poor prognosis in multiple myeloma

, , , &
Pages 1511-1520 | Received 14 Aug 2014, Accepted 03 Oct 2014, Published online: 18 Dec 2014

Figures & data

Figure 1. HDAC genes are overexpressed in human myeloma cell lines when compared to normal plasma cells Expression levels of HDAC in 14 human myeloma cell lines (HMCL) were compared to normal plasma cells (normal; n = 9 ). Class I HDAC (HDAC1, HDAC2, HDAC3, and HDAC8) were all significantly overexpressed. Among the class II HDAC, HDAC5 and HDAC10 were significantly overexpressed. Data are presented as mean±SEM. Significant differences were calculated with t-test utilizing GraphPad Prism 5.0d. p-values are indicated.
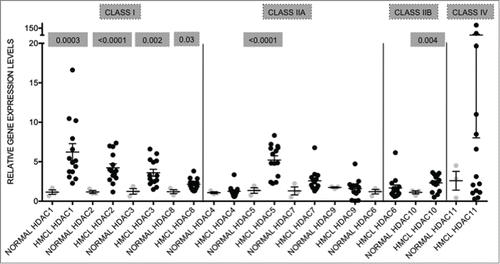
Figure 1. HDAC genes are overexpressed in human myeloma cell lines when compared to normal plasma cells Expression levels of HDAC in 14 human myeloma cell lines (HMCL) were compared to normal plasma cells (normal; n = 9 ). Class I HDAC (HDAC1, HDAC2, HDAC3, and HDAC8) were all significantly overexpressed. Among the class II HDAC, HDAC5 and HDAC10 were significantly overexpressed. Data are presented as mean±SEM. Significant differences were calculated with t-test utilizing GraphPad Prism 5.0d. p-values are indicated.

Table 1. HDAC1-2 (Class I HDAC) are overexpressed in all HMCL

Table 2. Patient characteristics-Gene expression cohort

Figure 2. HDAC levels are dysregulated in primary MM Expression levels of HDAC in primary MM (n = 55 ) were compared to normal plasma cells (normal; n = 9 ). All genes, except HDAC1 and HDAC11, were significantly altered. Data are presented as median with range. Significant differences were calculated utilizing Mann-Whitney test in GraphPad Prism 5.0d. P-values are indicated.
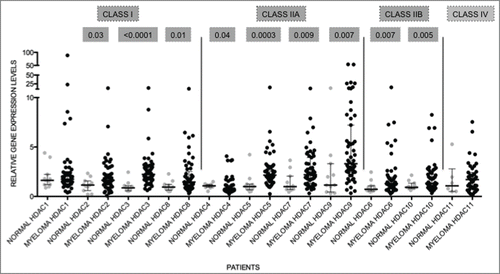
Figure 2. HDAC levels are dysregulated in primary MM Expression levels of HDAC in primary MM (n = 55 ) were compared to normal plasma cells (normal; n = 9 ). All genes, except HDAC1 and HDAC11, were significantly altered. Data are presented as median with range. Significant differences were calculated utilizing Mann-Whitney test in GraphPad Prism 5.0d. P-values are indicated.

Figure 3. Increased HDAC levels correlate to poor prognosis Kaplan-Meir plots showing progression-free survival (PFS) in MM patients with high (>75th centile of MM patient cohort) compared to low (<75th centile) expression profiles. (A-E) Patients with high HDAC1, HDAC2, HDAC4, HDAC6, and HDAC11 expression depicted significantly shorter PFS days than patients with low levels of these genes. Significant differences and median survival days were calculated utilizing GraphPad Prism 5.0d. P-values are indicated.
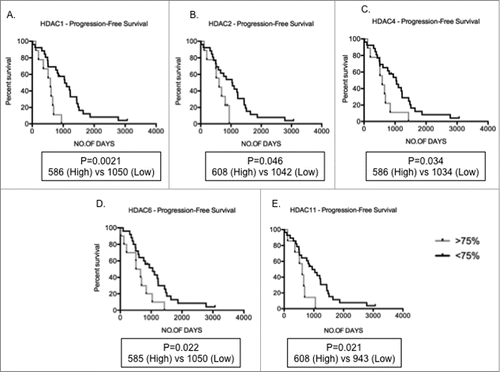
Figure 3. Increased HDAC levels correlate to poor prognosis Kaplan-Meir plots showing progression-free survival (PFS) in MM patients with high (>75th centile of MM patient cohort) compared to low (<75th centile) expression profiles. (A-E) Patients with high HDAC1, HDAC2, HDAC4, HDAC6, and HDAC11 expression depicted significantly shorter PFS days than patients with low levels of these genes. Significant differences and median survival days were calculated utilizing GraphPad Prism 5.0d. P-values are indicated.

Table 3. Immunohistochemistry for HDAC1 and HDAC6 on bone marrow trephines of MM patients

Figure 4. Higher HDAC1 levels correlate with poor prognosis (A) Image depicting low staining of HDAC1 (20%) in MM cells; (B) Image depicting high proportion of HDAC1 staining (90%) in MM cells; (C) Kaplan-Meir survival plots for patients with 0–20%, 30–80%, and 90–100% proportion of HDAC1 staining, indicating patients with higher proportion of HDAC1 have shorter progression-free survival days; (D) Kaplan-Meir survival plots for patients with 0–20%, 30–80% and 90–100% proportion of HDAC1 staining indicating patients with higher proportion of HDAC1 have shorter overall survival days. Patients with >70% infiltration of MM cells was chosen for image capture. Significant differences and median survival days were calculated utilizing GraphPad Prism 5.0d and p-values are indicated.
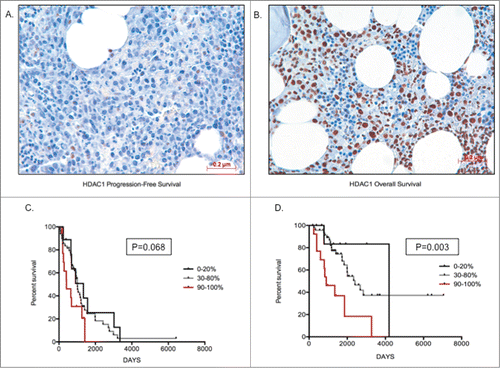
Figure 4. Higher HDAC1 levels correlate with poor prognosis (A) Image depicting low staining of HDAC1 (20%) in MM cells; (B) Image depicting high proportion of HDAC1 staining (90%) in MM cells; (C) Kaplan-Meir survival plots for patients with 0–20%, 30–80%, and 90–100% proportion of HDAC1 staining, indicating patients with higher proportion of HDAC1 have shorter progression-free survival days; (D) Kaplan-Meir survival plots for patients with 0–20%, 30–80% and 90–100% proportion of HDAC1 staining indicating patients with higher proportion of HDAC1 have shorter overall survival days. Patients with >70% infiltration of MM cells was chosen for image capture. Significant differences and median survival days were calculated utilizing GraphPad Prism 5.0d and p-values are indicated.

Figure 5. The majority of patients show high HDAC6 staining in MM cells (A) Image depicting low proportion (30%) and weak staining intensity (+) of HDAC6 in MM cells; (B) Image depicting high proportion (90%) and strong staining intensity of HDAC6 in MM cells; (C) Graph representing the distribution of HDAC6 staining proportion and intensity in bone marrow trephines tested. Higher proportion of HDAC6 staining correlated to stronger staining intensity.
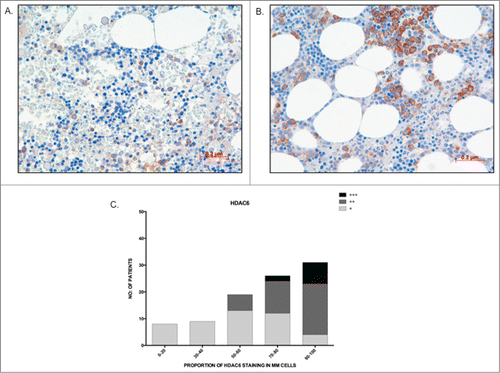
Figure 5. The majority of patients show high HDAC6 staining in MM cells (A) Image depicting low proportion (30%) and weak staining intensity (+) of HDAC6 in MM cells; (B) Image depicting high proportion (90%) and strong staining intensity of HDAC6 in MM cells; (C) Graph representing the distribution of HDAC6 staining proportion and intensity in bone marrow trephines tested. Higher proportion of HDAC6 staining correlated to stronger staining intensity.
Supplemental material

Supplementary_Table.docx

Download MS Word (313 KB)

Reprints and Corporate Permissions

Please note: Selecting permissions does not provide access to the full text of the article, please see our help page How do I view content?

To request a reprint or corporate permissions for this article, please click on the relevant link below:

Academic Permissions

Please note: Selecting permissions does not provide access to the full text of the article, please see our help page How do I view content?

Obtain permissions instantly via Rightslink by clicking on the button below:

If you are unable to obtain permissions via Rightslink, please complete and submit this Permissions form. For more information, please visit our Permissions help page.