Figures & data
Table 1. miRNA expression analyses in prostate cell lies. Each cell line was treated with 1α,25(OH)2D3 (100 nM) and ethanol as vehicle control for 30 minutes. Log2 changes in expression of miRNAs were calculated in 1α,25(OH)2D3 treated samples compared to ethanol treated samples. Number of up- and down-regulated miRNAs in response to 1α,25(OH)2D3 treatment in each cell line are shown. Characteristics and reported response to 1α,25(OH)2D3 for each cell line is also shown.
Table 2. miRNAs regulated in more than one cell line. Five miRNAs showed differential expression in more than one cell line upon 1α,25(OH)2D3 treatment. Table shows the regulated miRNAs, cell lines and their direction of expression change compared to ethanol within each cell line. Two arrows show the direction of expression change in respective cell lines (↑) up-regulated, (↓) downregulated.
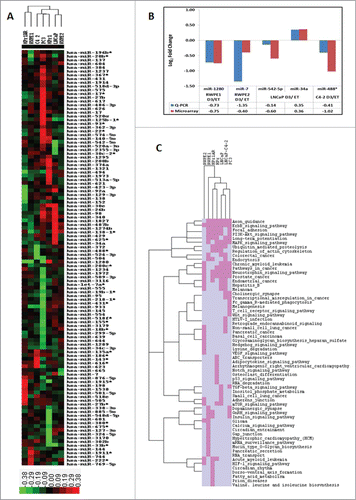
Figure 1 (See previous page). Regulation of miRNAs in response to 1α,25(OH)2D3 in prostate cell lines. (A) Heatmap of miRNA expression profile across 7 prostate cell lines. The cell lines were treated with either 1α,25(OH)2D3 or ethanol for 30 minutes and genome-wide miRNA expression analysis was performed using Exiqon microarrays. Differential expression of miRNAs was calculated in treated samples compared to ethanol vehicle control samples for each cell line. Hierarchical clustering of 7 prostate cell lines was performed using log2 fold changes values of 111 miRNAs across all the cell lines. Hierarchical clustering was performed using Cluster 3.0 and the clusters were visualized by Tree View. Clustering of cell lines showed the separation of cell lines based on their phenotypic characteristics. (B) To validation the microarray results 5 miRNAs across 4 different cell lines were tested using miRNA specific TapMan probes. Validation by Q-PCR showed concordant results for all 5 miRNAs tested. (C) Pathways analysis of miRNAs target genes for significant miRNAs in each cell lines was performed using DIANA-mirPath. Top 20 significantly enriched miRNA targeted pathways for individual cell lines were selected and a unique list of pathways was generated. Pathways were given a score of 1 or 0 if they are present or absent, respectively, in each cell line and hierarchical clustering was performed as described for miRNA expression. Hierarchical clustering of top 20 significantly enriched miRNA targeted pathways for each cell line showed separation of non-malignant and malignant cell lines. Pink color shows the presence of the pathway in the cell lines whereas gray color show absence of the pathway.

Table 3. Showing distribution of VDR peaks near miRNAs regulated by 1α,25(OH)2D3 in prostate cell lines. Genomic coordinates of all the regulated miRNAs across all the prostate cell lines were downloaded from miRbase and overlapped with combined list of VDR peaks from 5 published VDR ChIP-seq data sets. Number of VDR peak in defined flanking regions of 1α,25(OH)2D3 regulated miRNAs were compared to number of VDR peak in similar flanking regions of all the miRNAs reported in miRbase. Statistical significance of enrichment of VDR peaks was calculated using hypergeometric test and P ≤ 0 .05 was considered significant.
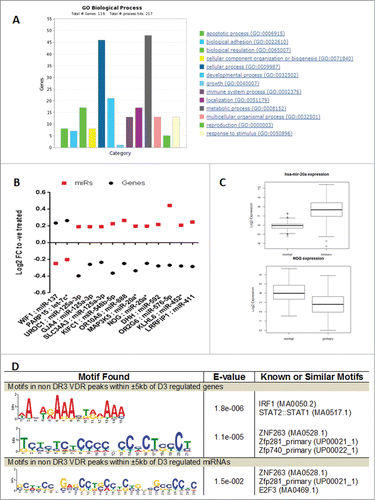
Figure 2 (See previous page). Functional annotation of 1α,25(OH)2D3-regulated mRNA genes in RWPE-1 cells and their co-regulation with miRNAs. (A). Biological processes enriched in the set of genes modulated by 1α,25(OH)2D3 in RWPE-1 cells were identified through PANTHER gene list analysis tool. The graph shows significantly enriched biological process and the number of genes in each process which is regulated. (B) The miRNAs and their predicted targets co-regulated in RWPE-1 in response to 1α,25(OH)2D3. Gene and miRNAs pairs showing negative correlation and their expression levels are shown. (C) Shows the reciprocal expression of miR-20a and its predicted target gene NOG. miRNA and mRNA expression (RNA-seq) data was downloaded from TCGA data portal. Raw expression values were log2 transformed and t-test was performed between normal tissue and tumors to identify significant difference in expression after FDR correction. Box plot show that miR-20a is upregulated in tumors where and its predicted target gene NOG is down regulated in tumors suggesting reciprocal relation between miRNA and its target mRNA. (D) Shows the enriched DNA binding motifs under the VDR peaks which does not contain DR3-type motif and present within ±5 kb of mRNA and miRNAs genes. Motif search was performed using MEME-ChIP tool of MEME suite.

