Figures & data
Table 1a. Baseline characteristics of the parents according to offspring birth weight. (AGA, appropriately grown for gestational age, or FGR, fetal growth restriction).
Table 1b. Pregnancy characteristics according to offspring birth weight (FGR or AGA), nature of samples analyzed (cord blood or placenta), and gestational age at birth (all samples, or term > 255 d gestation). Results expressed as mean ± SD
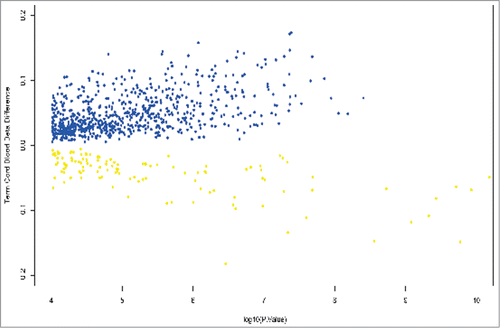
Figure 1. Volcano plot showing differentially methylated positions in umbilical cord blood between growth restricted (FGR) and appropriately grown offspring (AGA) at term gestation. β values are plotted against log P values. Hypermethylated positions are shown in blue and hypomethylated positions in yellow. A β methylation value of 10% is represented as 0.1.

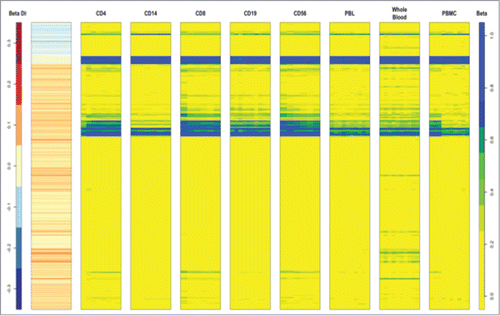
Figure 2. Heat map of the 839 DMPs between FGR and AGA in circulating cord blood cell subtypes identified as CD4, CD14, CD8, CD19, CD56, peripheral blood leucocytes, whole blood or peripheral blood mononuclear cells from 109 different samples. 450K data from a publicly available database Marmal-aid (http://marmal-aid.org.)Citation25 (see methods). There is very little difference in methylation between the 839 DMPs according to cell subtype. This is portrayed as similar color profiles for each of the cell types (blue, yellow and green) that correspond to the level of β methylation (far column) of the 839 probes.

Table 2a. The most methylated DMPs (β value >+10%) in umbilical cord blood from FGR compared with AGA offspring. Columns show CG identifying site, chromosome number, chromosome coordinate, gene identifier, chromosome number, methylation β value, and adjusted P value for difference in mean β value between FGR and AGA offspring and M value
Table 2b. Table shows the most hypomethylated DMPs (β value >−10%) in umbilical cord blood from FGR compared with AGA offspring. Columns show CG identifying site, chromosome number, chromosome coordinate, gene identifier, chromosome number, methylation β value, and adjusted P value for difference in mean β value between FGR and AGA offspring and M value
Table 3. Twenty-three GO pathways identified using 839 DMPs within FGR term umbilical cord blood samples. Fold change refers to the number of DMP on genes actually present in the pathway compared with the number expected and that met the P-value < 0.0001 and cut off of 2-fold change (rounded up). The last 2 columns report the most differentially methylated genes (>10 %) found in the respective GO pathway.
Table 4. GO pathway analysis of 284 placental DMPs associated with our FGR cohort. These DMPs were identified after validation analysis with an external data set of placentas from healthy pregnancies across 3 trimesters.Citation17 After excluding DMPs that were present on both platforms and assumed to be associated with gestational age, the remaining 284 DMPs remained unique to our FGR cohort. Sixteen functional pathways met the criteria for reporting. Pathways known to be associated with fetal growth restriction and that were evident in the placenta of our FGR cohort included autophagy, response to oxidative stress and the regulation of monocyte chemotaxis. The actual and expected number of DMPs on genes in the pathway is recorded and the fold change between these counts that met the P-value <0.0001 and cut off of >2-fold change
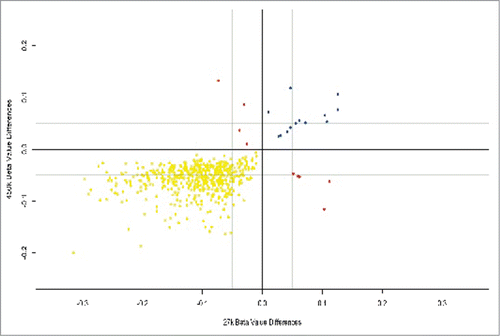
Figure 3. Placental DMPs between 2nd and 3rd trimesters in our data set using the Infinium HumanMethylation450 Beadchip® and also present in an external data set using the Infinium HumanMethylation27.Citation17 There were 519 hypomethylated DMPs common to both platforms (yellow), 13 hypermethylated DMPs common to both platforms (blue) and 9 DMPs that were mismatched with regards direction of methylation (red).

