Figures & data
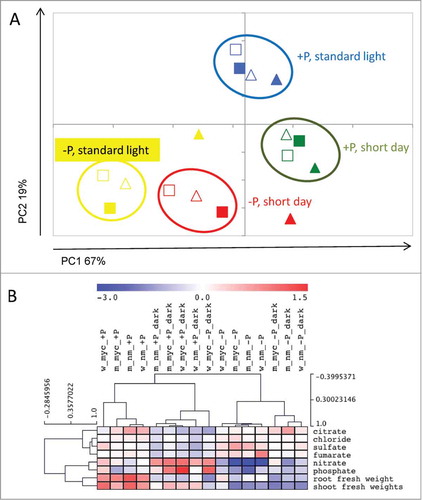
Figure 1. Metabolic responses of Medicago truncatula wildtype and mtha1-2 mutant plants to mycorrhization, phosphate supply and day length. Ion concentrations in leaves were analyzed from leaf samples of 5-week-old plants, grown for 3 weeks under the stated conditions. The plots were applied for contents of 6 ions (phosphate, sulfate, nitrate, citrate, fumarate and chloride) and root and shoot fresh weight per plant. Data shown are averages of 3 biological replicates. (A) Principal component analysis (PCA) of ion contents and fresh weight data. Triangles represent wildtype plants, squares represent mtha1-2 mutant plants. Filled symbols represent mycorrhizal plants. Yellow: plants were grown at strong phosphate starvation (20 μM) and standard light regime (16/8 h), red: plants were grown at strong phosphate starvation and short day condition (12/12 h), green: plants were grown at moderate phosphate starvation (1 mM) and short day condition, blue: plants were grown at moderate phosphate starvation and standard light regime. (B) Clustering of ion content and fresh weight data showed that values derived from mycorrhizal mtha1-2 plants (m_myc) group with data from non-mycorrhizal plants (w_nm or m_nm), whereas mycorrhizal wildtype values (w_myc) are clearly separated from all other samples. This is independent of P nutrition (_−P or _+P) and day length (_dark = short day conditions). Data were normalized on the average of the values obtained from all samples. The data with log2 scale were submitted to Hierarchical Clustering Analysis (HCA) using Pearson correlation to identify clusters of similar profiles.