1,334
Views
4
CrossRef citations to date
0
Altmetric
Research Paper

Alteration of Arabidopsis SLAC1 promoter and its association with natural variation in drought tolerance

, &
Article: e989761 | Received 16 Sep 2014, Accepted 07 Oct 2014, Published online: 21 Apr 2015

Figures & data

Figure 1. Comparison of drought tolerance in Col-0 and Ws-2. Data are expressed as the relative decrease in fresh weight (the value at 0 min was set to 100%). Values are means ± SD (n=11 for Col-0; n=10 for Ws-2). Asterisks indicate significant differences from Col-0 (P < 0.01).
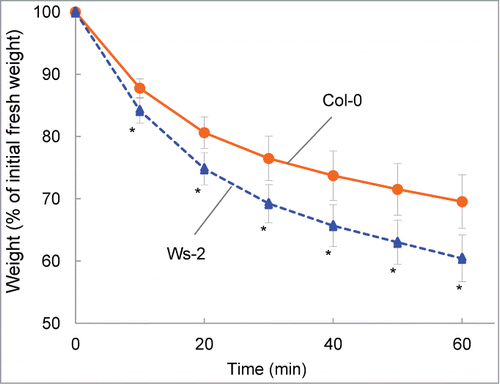
Figure 1. Comparison of drought tolerance in Col-0 and Ws-2. Data are expressed as the relative decrease in fresh weight (the value at 0 min was set to 100%). Values are means ± SD (n=11 for Col-0; n=10 for Ws-2). Asterisks indicate significant differences from Col-0 (P < 0.01).

Figure 2. Changes in leaf surface temperature under drought condition in detached seedlings. (A) Upper panels: visible light images of Col-0 and Ws-2 at 10-min intervals after detachment. Lower panels: false-color thermal images of the leaf surface of the same seedlings. Color coding is explained on the right side. (B) Average leaf surface temperature of Col-0 and Ws-2. Data represent means ± SD. Asterisk indicates a significant difference from Col-0 (P < 0.01).
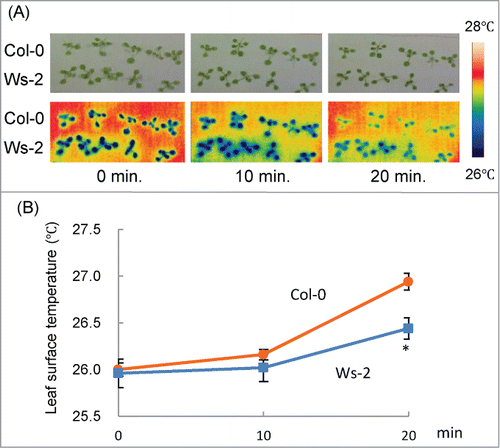
Figure 2. Changes in leaf surface temperature under drought condition in detached seedlings. (A) Upper panels: visible light images of Col-0 and Ws-2 at 10-min intervals after detachment. Lower panels: false-color thermal images of the leaf surface of the same seedlings. Color coding is explained on the right side. (B) Average leaf surface temperature of Col-0 and Ws-2. Data represent means ± SD. Asterisk indicates a significant difference from Col-0 (P < 0.01).

Figure 3. Genome scans for drought tolerance of Col-0 and Ws-2. (A) QTL likelihood maps produced by composite interval mapping using the drought tolerance experiment data at 30 min. The dotted orange line shows the LOD score of 3. (B) Location of the genes known to be involved in the regulation of stomatal movement in Arabidopsis (Daszkowska-Golec and Szarejko, 2013) is shown at the right of each chromosome. The region marked in orange corresponds to the highest LOD peak found in (A).
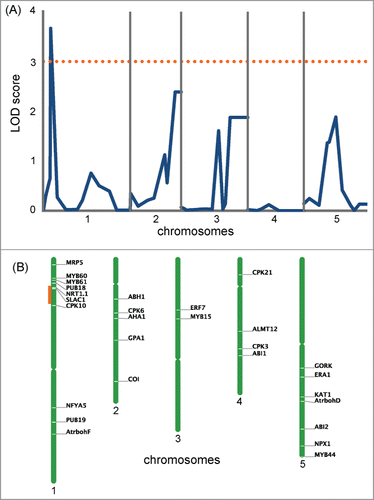
Figure 3. Genome scans for drought tolerance of Col-0 and Ws-2. (A) QTL likelihood maps produced by composite interval mapping using the drought tolerance experiment data at 30 min. The dotted orange line shows the LOD score of 3. (B) Location of the genes known to be involved in the regulation of stomatal movement in Arabidopsis (Daszkowska-Golec and Szarejko, 2013) is shown at the right of each chromosome. The region marked in orange corresponds to the highest LOD peak found in (A).

Figure 4. Differences in genomic structure upstream of SLAC1 between Col-0 and Ws-2. (A) Genomic structure upstream of SLAC1. Genes are shown as arrows in the direction of transcription. Regions syntenic in Col-0 and Ws-2 are indicated by the same color. Direct repeats in the SLAC1 promoter are shown as blue chevron arrows. Locations of the primers used in (B) are shown by black arrows. (B) PCR amplification of the SLAC1 promoter region. Positions of PCR products are indicated by red arrows. M, λ/Hind III size marker; C, Col-0; W, Ws-2.
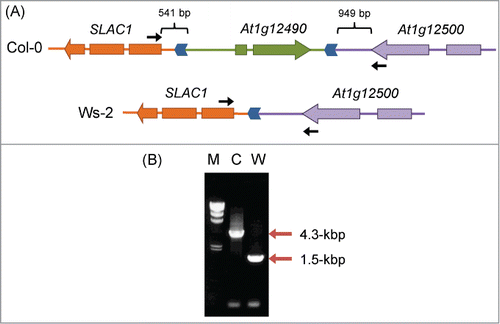
Figure 4. Differences in genomic structure upstream of SLAC1 between Col-0 and Ws-2. (A) Genomic structure upstream of SLAC1. Genes are shown as arrows in the direction of transcription. Regions syntenic in Col-0 and Ws-2 are indicated by the same color. Direct repeats in the SLAC1 promoter are shown as blue chevron arrows. Locations of the primers used in (B) are shown by black arrows. (B) PCR amplification of the SLAC1 promoter region. Positions of PCR products are indicated by red arrows. M, λ/Hind III size marker; C, Col-0; W, Ws-2.

Figure 5. Drought tolerance in At1g12490 knockout mutants. (A) Locations of the T-DNA insertions in At1g12490 are indicated by arrows. (B) Drought tolerance in Col-0, Ws-2 and knock-out plants. Data are expressed as the relative decrease in fresh weight (the value at 0 min was set to 100%). Values are means ± SD. n=11 for Col-0, n=11 for Ws-2 and n=3 for the other 3.
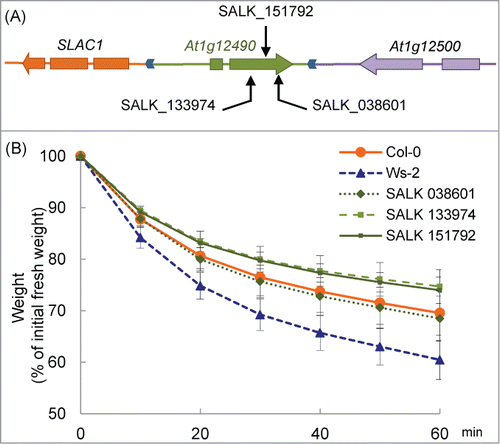
Figure 5. Drought tolerance in At1g12490 knockout mutants. (A) Locations of the T-DNA insertions in At1g12490 are indicated by arrows. (B) Drought tolerance in Col-0, Ws-2 and knock-out plants. Data are expressed as the relative decrease in fresh weight (the value at 0 min was set to 100%). Values are means ± SD. n=11 for Col-0, n=11 for Ws-2 and n=3 for the other 3.

Figure 6. Histochemical localization of GUS activity in transgenic plants. (A, B) GUS staining in the leaves of Col-0 transformants carrying of pSLAC1-Col::GUS was specifically observed in guard cells. (C, D) GUS staining in the leaves of Ws-2 transformants carrying pSLAC1-Ws::GUS was detected in guard cells and predominantly in leaf veins.
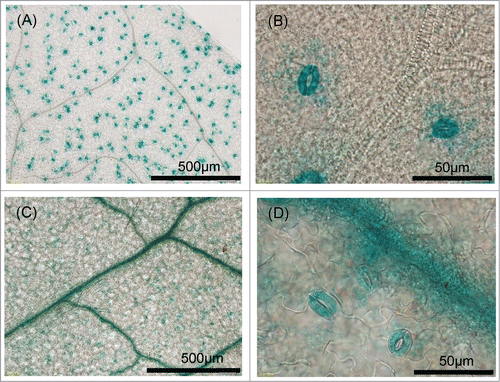
Figure 6. Histochemical localization of GUS activity in transgenic plants. (A, B) GUS staining in the leaves of Col-0 transformants carrying of pSLAC1-Col::GUS was specifically observed in guard cells. (C, D) GUS staining in the leaves of Ws-2 transformants carrying pSLAC1-Ws::GUS was detected in guard cells and predominantly in leaf veins.

Figure 7. SLAC1 expression in leaves. (A) Transcript levels of SLAC1 in whole leaves. (B) Transcript levels of SLAC1 and Carbonic anhydrase (CA) in guard cell protoplasts. CA expression was assessed to check the purity of guard cell protoplasts. Low level of CA expression shows that the guard cells were highly purified. (C) Transcript levels of SLAC1 and CA in mesophyll protoplasts. Transcript level of each gene is presented relative to the Actin expression level. Values are means ± SD (n = 3). Asterisks indicate significant differences from Col-0 (P <0.01).
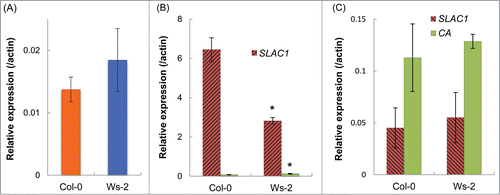
Figure 7. SLAC1 expression in leaves. (A) Transcript levels of SLAC1 in whole leaves. (B) Transcript levels of SLAC1 and Carbonic anhydrase (CA) in guard cell protoplasts. CA expression was assessed to check the purity of guard cell protoplasts. Low level of CA expression shows that the guard cells were highly purified. (C) Transcript levels of SLAC1 and CA in mesophyll protoplasts. Transcript level of each gene is presented relative to the Actin expression level. Values are means ± SD (n = 3). Asterisks indicate significant differences from Col-0 (P <0.01).

Reprints and Corporate Permissions

Please note: Selecting permissions does not provide access to the full text of the article, please see our help page How do I view content?

To request a reprint or corporate permissions for this article, please click on the relevant link below:

Academic Permissions

Please note: Selecting permissions does not provide access to the full text of the article, please see our help page How do I view content?

Obtain permissions instantly via Rightslink by clicking on the button below:

If you are unable to obtain permissions via Rightslink, please complete and submit this Permissions form. For more information, please visit our Permissions help page.