814
Views
7
CrossRef citations to date
0
Altmetric
RESEARCH PAPERS

Sheep prions with molecular properties intermediate between classical scrapie, BSE and CH1641–scrapie

, , , , , , , , , , & show all
Pages 296-305 | Received 23 Sep 2014, Accepted 27 Oct 2014, Published online: 18 Dec 2014

Figures & data

Table 1. Brain stem tissue detailsFootnotea

Figure 1. Triplex-WB analysis picture of study cases together with some reference samples. Selection of samples analyzed include all study cases numbers F1–F7. All lanes contain ovine samples except lanes 10 and 22, respectively caprine CH1641 Cgt and bovine BSE-H. Lanes 6, 8, 9, 14, 19, and 21: ovine CH1641 samples C8, C9, C1, C7, C3, and C6; lane 11 experimental scrapie J1; lanes 23 and 24 respectively ovine classical scrapie N18 and BSE B4 (details of case codes in Table 1). In the triplex‑WBs a mix of the 3 antibodies L42, 12B2 and SAF84 was applied. As an example for the glycoprofile estimation, the white bar shows the typical triple band (3 arrows) area in the L42 and SAF84 channels, thus neglecting the 2 lower bands that are visible in CH1641 samples. The migration position of mono‑glycosylated PrPres fraction (at ± 24 kDa) is indicated with a black arrow, the di-glycosylated and non-glycosylated fractions (white arrows) migrate respectively above and below the 24kDa band in this triplet region. Marker proteins used are: rec‑ovPrP in lane 1; molecular mass markers in lanes 2, 17, 18 and 25 with in lane 2 the molecular masses in kDa. TE applied per lane: 0.5 mg in lanes 3, 21–24, 0.8 mg in lane 7, 1 mg in lanes 4–6, 8–16, 19–20. See Methods section for antibody details and fluorescence detection.
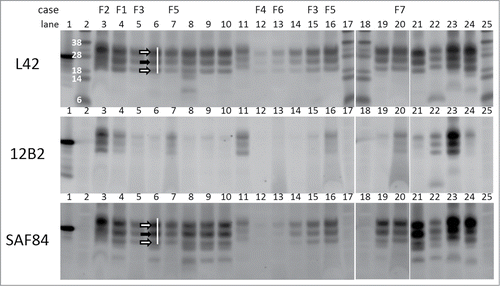
Figure 1. Triplex-WB analysis picture of study cases together with some reference samples. Selection of samples analyzed include all study cases numbers F1–F7. All lanes contain ovine samples except lanes 10 and 22, respectively caprine CH1641 Cgt and bovine BSE-H. Lanes 6, 8, 9, 14, 19, and 21: ovine CH1641 samples C8, C9, C1, C7, C3, and C6; lane 11 experimental scrapie J1; lanes 23 and 24 respectively ovine classical scrapie N18 and BSE B4 (details of case codes in Table 1). In the triplex‑WBs a mix of the 3 antibodies L42, 12B2 and SAF84 was applied. As an example for the glycoprofile estimation, the white bar shows the typical triple band (3 arrows) area in the L42 and SAF84 channels, thus neglecting the 2 lower bands that are visible in CH1641 samples. The migration position of mono‑glycosylated PrPres fraction (at ± 24 kDa) is indicated with a black arrow, the di-glycosylated and non-glycosylated fractions (white arrows) migrate respectively above and below the 24kDa band in this triplet region. Marker proteins used are: rec‑ovPrP in lane 1; molecular mass markers in lanes 2, 17, 18 and 25 with in lane 2 the molecular masses in kDa. TE applied per lane: 0.5 mg in lanes 3, 21–24, 0.8 mg in lane 7, 1 mg in lanes 4–6, 8–16, 19–20. See Methods section for antibody details and fluorescence detection.

Figure 2. Schematic bar diagram of PrPres to illustrate the relative position of the 3 epitopes used in this study. The bar length reflects the length of a PrP monomer in classical scrapie PrPres (PrP residues ± 76–234). The epitope position of antibodies 12B2, L42 and SAF84 are reflected by the colored boxes with respectively blue, red and green (color choices agree with wave length of fluorescence emission signals, see Methods section). The PrP location of antibodies 12B2, L42 and SAF84 corresponds respectively with that of group A, B and C antibodies as described by us previously.Citation35 The location of the 2 glycosylgroups are indicated by S. The solid black lined box indicates the removal by proteinase K of N-terminal PrP region in BSE and CH1641, which in CH1641 is even a few residues further down stream than in BSE. The broken black lined box indicates the length of the second PrPres population (PrPres#2) as occurring in CH1641, where the 12B2 epitope is absent and the L42 epitope incomplete, thus only allowing full binding by SAF84. Sugar moieties are variably present in both PrPres populations of CH1641, and in PrPres from classical scrapie and BSE.

Figure 2. Schematic bar diagram of PrPres to illustrate the relative position of the 3 epitopes used in this study. The bar length reflects the length of a PrP monomer in classical scrapie PrPres (PrP residues ± 76–234). The epitope position of antibodies 12B2, L42 and SAF84 are reflected by the colored boxes with respectively blue, red and green (color choices agree with wave length of fluorescence emission signals, see Methods section). The PrP location of antibodies 12B2, L42 and SAF84 corresponds respectively with that of group A, B and C antibodies as described by us previously.Citation35 The location of the 2 glycosylgroups are indicated by S. The solid black lined box indicates the removal by proteinase K of N-terminal PrP region in BSE and CH1641, which in CH1641 is even a few residues further down stream than in BSE. The broken black lined box indicates the length of the second PrPres population (PrPres#2) as occurring in CH1641, where the 12B2 epitope is absent and the L42 epitope incomplete, thus only allowing full binding by SAF84. Sugar moieties are variably present in both PrPres populations of CH1641, and in PrPres from classical scrapie and BSE.

Figure 3. Western blot results transformed into values to express 5 different PrPres properties. In the 5 panels are expressed: (A) molecular mass of non-glycosylated PrP as observed with mAb L42 (see Fig. 1); (B) N-terminal epitope content expressed as 12B2/L42 ratio; (C) PK resistance as a ratio of L42 signals at pH 8 and pH 6.5; (D) glycoprofile expressed as L42 signal ratio M/D, where M and D are the respective mono-glycosylated and di-glycosylated fractions of the 3 PrPres bands (see Fig. 1); (E) marker for the presence of a dual PrPres population as estimated by SAF84/L42 ratio of the 24 kDa fraction of total PrPres triplet (see Fig. 1). Black bars represent averages ± SD of the reference samples indicated on the horizontal axis with the number of different samples per group between parentheses. The open bars represent data of the 7 study samples F1–F7 with averages ± SD for 2–7 measurements per sample, except for panel c where single measurements have been carried out; for these cases bar-values are specified above the bars.

Figure 3. Western blot results transformed into values to express 5 different PrPres properties. In the 5 panels are expressed: (A) molecular mass of non-glycosylated PrP as observed with mAb L42 (see Fig. 1); (B) N-terminal epitope content expressed as 12B2/L42 ratio; (C) PK resistance as a ratio of L42 signals at pH 8 and pH 6.5; (D) glycoprofile expressed as L42 signal ratio M/D, where M and D are the respective mono-glycosylated and di-glycosylated fractions of the 3 PrPres bands (see Fig. 1); (E) marker for the presence of a dual PrPres population as estimated by SAF84/L42 ratio of the 24 kDa fraction of total PrPres triplet (see Fig. 1). Black bars represent averages ± SD of the reference samples indicated on the horizontal axis with the number of different samples per group between parentheses. The open bars represent data of the 7 study samples F1–F7 with averages ± SD for 2–7 measurements per sample, except for panel c where single measurements have been carried out; for these cases bar-values are specified above the bars.

Figure 4. Dual PrPres population composition analysis with SAF84 antibody. (A) Triplex-WB of an selection of the samples analyzed, containing 7 study cases (lanes 3–9) and a set of CH1641 cases (lanes 10–17, 22–23), ovine BSE (lanes 18–19), and ovine scrapie (lanes 20-21). The PrPres samples were deglycosylated using PNGaseF. The position of deglycosylated bands 1 and 2 at respectively at 10–12 kDa and 18–21 kDa is indicated. For case details see Table 1. All lanes presented were scanned at 532 nm excitation wavelength, except lane 24 at 633 nm. Molecular mass references: lane 1 rec-ovPrP, lanes 2 and 24 blue molecular mass markers that yield a strong signal at excitation wavelength 633 nm (in kDa). TE applied per lane: 0.25 mg in lanes 4, 18–20, and 0.5 mg in lanes 3, 5–17, 21–23. (B) Dotplot of the 2 methods of dual population estimation. Vertical axis, the ratio between SAF84/L42 fraction of the 24kDa band in the PrPres triplet (see Fig. 1). Horizontal axis, the band 2 versus band 1 ratio estimated in blots of the 54 cases as exemplified in panel a. For all samples analyzed a linear regression correlation curve is presented together with the mathematical curve data and regression value R2.
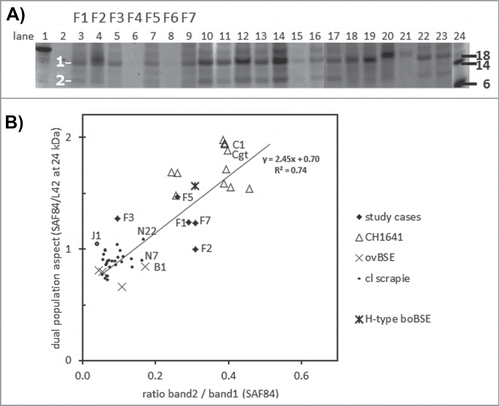
Figure 4. Dual PrPres population composition analysis with SAF84 antibody. (A) Triplex-WB of an selection of the samples analyzed, containing 7 study cases (lanes 3–9) and a set of CH1641 cases (lanes 10–17, 22–23), ovine BSE (lanes 18–19), and ovine scrapie (lanes 20-21). The PrPres samples were deglycosylated using PNGaseF. The position of deglycosylated bands 1 and 2 at respectively at 10–12 kDa and 18–21 kDa is indicated. For case details see Table 1. All lanes presented were scanned at 532 nm excitation wavelength, except lane 24 at 633 nm. Molecular mass references: lane 1 rec-ovPrP, lanes 2 and 24 blue molecular mass markers that yield a strong signal at excitation wavelength 633 nm (in kDa). TE applied per lane: 0.25 mg in lanes 4, 18–20, and 0.5 mg in lanes 3, 5–17, 21–23. (B) Dotplot of the 2 methods of dual population estimation. Vertical axis, the ratio between SAF84/L42 fraction of the 24kDa band in the PrPres triplet (see Fig. 1). Horizontal axis, the band 2 versus band 1 ratio estimated in blots of the 54 cases as exemplified in panel a. For all samples analyzed a linear regression correlation curve is presented together with the mathematical curve data and regression value R2.

Figure 5. Two features for BSE and CH1641 recognition in TSE-infected sheep plotted for individual samples. The sample numbers for the 7 French samples and for some other samples (goat CH1641 case Cgt, NIAH experimental scrapie case J1, NIAH experimental CH1641 case C1). By surrounding data points by the dashed circles, it is clear that the 7 study cases exhibit an intermediate behavior between scrapie, BSE and CH1641.
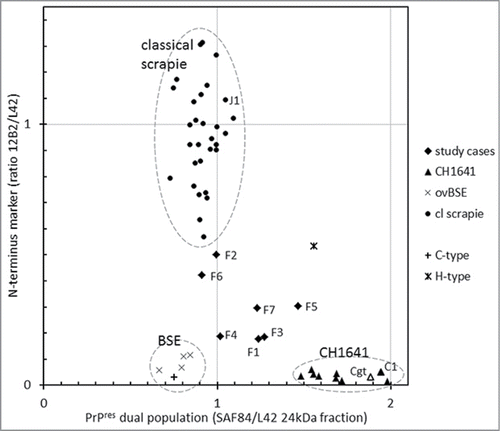
Figure 5. Two features for BSE and CH1641 recognition in TSE-infected sheep plotted for individual samples. The sample numbers for the 7 French samples and for some other samples (goat CH1641 case Cgt, NIAH experimental scrapie case J1, NIAH experimental CH1641 case C1). By surrounding data points by the dashed circles, it is clear that the 7 study cases exhibit an intermediate behavior between scrapie, BSE and CH1641.