
Figures & data
Table 1 Effects of socio-demographic characteristics on H. pylori prevalence odds among 368 community H. pylori project participants, Northwest and Yukon Territories, 2008–2011.
Table 2 Pathways for zoonotic transmission: Exposure prevalence and exposure-specific H. pylori prevalence by community among 368 community H. pylori project participants, Northwest and Yukon Territories, 2008–2011
Table 3 Pathways for zoonotic transmission: Results of multivariable logistic regression analysis of effects on H. pylori prevalence odds among 368 community H. pylori project participants, Northwest and Yukon Territories, 2008–2011
Table 4 Pathways for waterborne transmission: Exposure prevalence and exposure-specific H. pylori prevalence by community among 368 community H. pylori project participants, Northwest and Yukon Territories, 2008–2011
Table 5: Pathways for waterborne transmission: Results of multivariable logistic regression analysis of effects on H. pylori prevalence odds among 368 community H. pylori project participants, Northwest and Yukon Territories, 2008–2011
Table 6: Effects of household composition variables on H. pylori prevalence odds among 368 community H. pylori project participants, Northwest and Yukon Territories, 2008–2011
Figure 1. Random effect of household (SD) relative to the effect of independent variables in the model. Model 1. Household Random Effect (SD): 1.26; 95%CI: 0.70, 2.3 Model 2. Household Random Effect (SD): 1.16; 95%CI: 0.59, 2.3) Model 3. Household Random Effect (SD): 1.11; 95%CI: 0.54, 2.3 Model 4. Household Random Effect (SD): 0.62; 95%CI: 0.96, 4.04 Model 5. Household Random Effect (SD): 0.43; 95%CI: 0.016, 11.3.
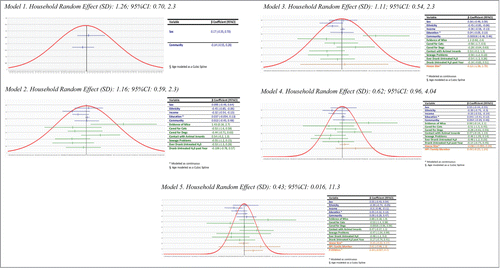
Table 7: Sensitivity analysis showing estimates based on different methods for classifying H. pylori infection status of participants with discordant results (n = 368)
Table 8 Variable definitions and response options for environmental exposures