5,465
Views
95
CrossRef citations to date
0
Altmetric
RESEARCH PAPER

Antibiotic-induced dysbiosis alters host-bacterial interactions and leads to colonic sensory and motor changes in mice

, &
Pages 10-23 | Received 27 Aug 2014, Accepted 12 Nov 2014, Published online: 20 Jan 2015

Figures & data

Figure 1. Colonic histopathology in vehicle- and antibiotic-treated mice. (A) Histopathological scores. (B) Goblet cell counts from PAS/AB pH = 2.5 stained-sections. (C) length of colonic crypts. (D) Thickness of the mucus layer, assessed on PAS/AB pH = 2.5 stained-sections. Bars represent the mean ± SEM, symbols represent individual animals. n = 7–8 per group, *: P < 0.05 vs. vehicle.
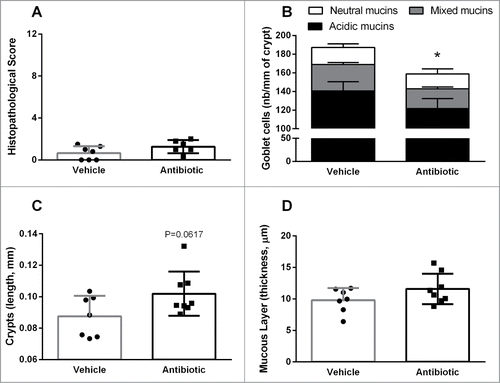
Figure 1. Colonic histopathology in vehicle- and antibiotic-treated mice. (A) Histopathological scores. (B) Goblet cell counts from PAS/AB pH = 2.5 stained-sections. (C) length of colonic crypts. (D) Thickness of the mucus layer, assessed on PAS/AB pH = 2.5 stained-sections. Bars represent the mean ± SEM, symbols represent individual animals. n = 7–8 per group, *: P < 0.05 vs. vehicle.

Figure 2. Characterization and quantification of luminal gut commensal microbiota. Data shows qPCR quantification of total bacteria and the main bacterial groups present in the colonic microbiota (see methods for details). Data are median (interquartile range) ± SD and are expressed as cells/g of feces; n = 7–8 for each group. *, **: P < 0.05 or 0.01 vs. vehicle group. The bottom-right graph shows the relative distribution of the ceco-colonic microbiota in vehicle- and antibiotic-treated mice. Data represent the relative abundance (percent) of the main bacterial groups present in the gut microbiota as quantified using qPCR. Relative percent composition was calculated taking as 100% the total counts of the different bacterial groups assessed (C. coccoides, Bacteroides spp., Bifidobacterium spp and Lactobacillus/Enterococcus spp).
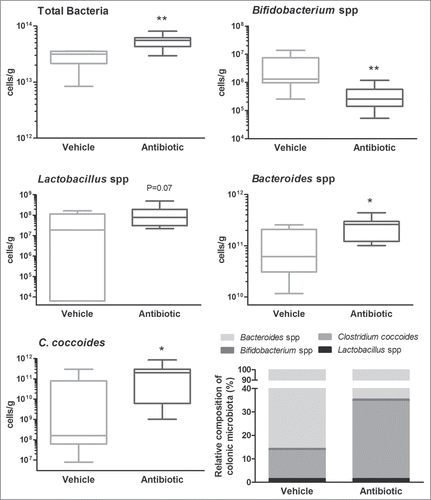
Figure 2. Characterization and quantification of luminal gut commensal microbiota. Data shows qPCR quantification of total bacteria and the main bacterial groups present in the colonic microbiota (see methods for details). Data are median (interquartile range) ± SD and are expressed as cells/g of feces; n = 7–8 for each group. *, **: P < 0.05 or 0.01 vs. vehicle group. The bottom-right graph shows the relative distribution of the ceco-colonic microbiota in vehicle- and antibiotic-treated mice. Data represent the relative abundance (percent) of the main bacterial groups present in the gut microbiota as quantified using qPCR. Relative percent composition was calculated taking as 100% the total counts of the different bacterial groups assessed (C. coccoides, Bacteroides spp., Bifidobacterium spp and Lactobacillus/Enterococcus spp).

Table 1. Incidence of bacterial wall adherence.Citation1

Figure 3. Representative colonic tissue images showing Clostridium spp (identified by FISH using the EREC 482 probe) adherence to the colonic epithelium. (A) Vehicle-treated animal. (B) Antibiotic-treated animal. (C) Non-treated naïve animal maintained in the same conditions as the experimental groups; included here for comparative purposes. (D) Negative control (hybridized with the control non-specific fluorescent probe NON338). In all cases (AC) abundant bacteria was observed attached to the colonic epithelium. Note, however, that bacillary-shaped bacteria were observed in vehicle-treated animals (A) (similarly to that observed in the non-treated naïve animal, (C) while in antibiotic-treated animals (B) a shift in morphology, with the appearance of abundant coccoidal forms, can be observed.
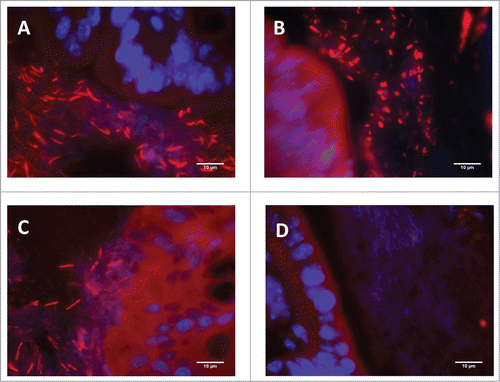
Figure 3. Representative colonic tissue images showing Clostridium spp (identified by FISH using the EREC 482 probe) adherence to the colonic epithelium. (A) Vehicle-treated animal. (B) Antibiotic-treated animal. (C) Non-treated naïve animal maintained in the same conditions as the experimental groups; included here for comparative purposes. (D) Negative control (hybridized with the control non-specific fluorescent probe NON338). In all cases (A–C) abundant bacteria was observed attached to the colonic epithelium. Note, however, that bacillary-shaped bacteria were observed in vehicle-treated animals (A) (similarly to that observed in the non-treated naïve animal, (C) while in antibiotic-treated animals (B) a shift in morphology, with the appearance of abundant coccoidal forms, can be observed.

Figure 4. Changes in immune and host-bacterial interaction markers. (A) Changes in innate immune-related markers: luminal levels of secretory IgA (S-IgA) and gene expression levels of antimicrobial peptides. (B) Changes in expression levels of pro- (IL-12p40, IL-6 and TNFα) and anti-inflammatory (IL-10) cytokines and the inducible nitric oxide synthase (iNOS). (C) Changes in the expression levels of TLRs. Data are mean ± SEM, n = 7–8 group, *: P < 0 .05 vs. vehicle.
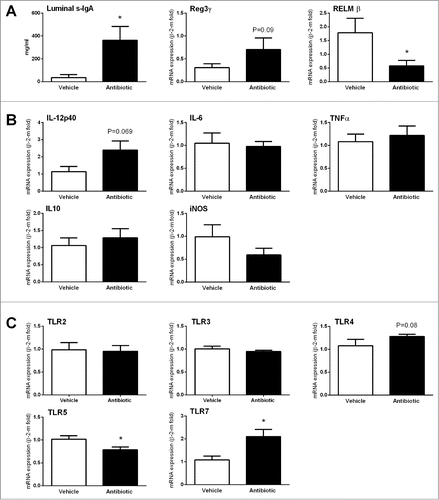
Figure 4. Changes in immune and host-bacterial interaction markers. (A) Changes in innate immune-related markers: luminal levels of secretory IgA (S-IgA) and gene expression levels of antimicrobial peptides. (B) Changes in expression levels of pro- (IL-12p40, IL-6 and TNFα) and anti-inflammatory (IL-10) cytokines and the inducible nitric oxide synthase (iNOS). (C) Changes in the expression levels of TLRs. Data are mean ± SEM, n = 7–8 group, *: P < 0 .05 vs. vehicle.

Figure 5. Changes in sensory-related markers. (A) Changes in colonic gene expression of cannabinoid receptors 1 and 2 (CB1/2), mu-opioid receptors (MOR) and nerve growth factor (NGF). Data are mean ± SEM, n = 5–8 animals per group. *, **, ***: P < 0.05, 0.01 or 0.001 vs. vehicle. (B) Quantification of immunorreactive ganglionic cells within the myenteric plexus in vehicle- and antibiotic-treated animals. Data are mean ± SEM, of 5–8 animals per group; see methods for details of the quantification procedures.
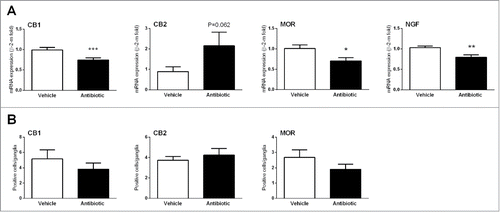
Figure 5. Changes in sensory-related markers. (A) Changes in colonic gene expression of cannabinoid receptors 1 and 2 (CB1/2), mu-opioid receptors (MOR) and nerve growth factor (NGF). Data are mean ± SEM, n = 5–8 animals per group. *, **, ***: P < 0.05, 0.01 or 0.001 vs. vehicle. (B) Quantification of immunorreactive ganglionic cells within the myenteric plexus in vehicle- and antibiotic-treated animals. Data are mean ± SEM, of 5–8 animals per group; see methods for details of the quantification procedures.

Figure 6. (A) Correlations between total luminal bacterial counts and sensory-related (CB1 and CB2) markers or TLRs. (B) Correlations between expression levels of TLR7 and sensory-related markers. Each point represents an individual animal. Broken lines represent the 95 % confidence interval.
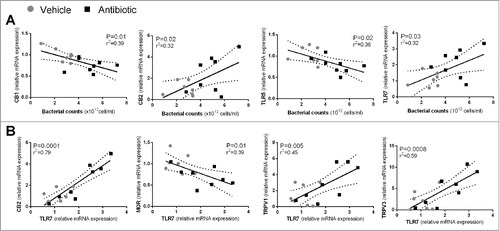
Figure 6. (A) Correlations between total luminal bacterial counts and sensory-related (CB1 and CB2) markers or TLRs. (B) Correlations between expression levels of TLR7 and sensory-related markers. Each point represents an individual animal. Broken lines represent the 95 % confidence interval.

Figure 7. Effects of antibiotic treatment on visceral pain-related responses. A: Intraperitoneal acetic acid- (AA, 0.6%) induced abdominal contractions. The left graph shows the total number of abdominal contractions during the observation time (30 min) in the different experimental groups. Each point represents an individual animal; the horizontal lines with errors correspond to the mean ± SEM. ***: P < 0 .001 vs. respective non-AA-treated control group. #: P < 0.05 vs. vehicle-AA group. The graph to the right shows the time-course (in 5-min intervals) for the pain-related responses in the same animals. B: Intracolonic capsaicin- (Caps) evoked visceral pain-related behaviors. The left graph shows the total number of behaviors during the observation time (30 min) in the different experimental groups. Each point represents an individual animal; the horizontal lines with errors correspond to the mean ± SEM. ***: P < 0.001 vs. respective non-capsaicin-treated control group. #: P < 0.05 vs. vehicle-Caps group. The graph to the right shows the time-course (in 5-min intervals) for the observation of pain-related behaviors in the same animals.
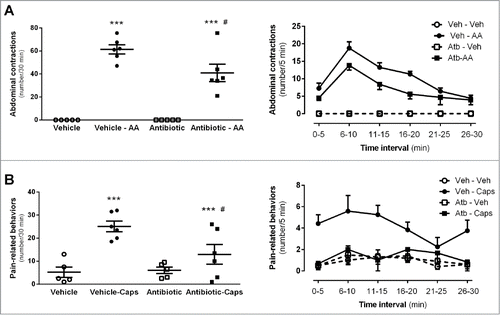
Figure 7. Effects of antibiotic treatment on visceral pain-related responses. A: Intraperitoneal acetic acid- (AA, 0.6%) induced abdominal contractions. The left graph shows the total number of abdominal contractions during the observation time (30 min) in the different experimental groups. Each point represents an individual animal; the horizontal lines with errors correspond to the mean ± SEM. ***: P < 0 .001 vs. respective non-AA-treated control group. #: P < 0.05 vs. vehicle-AA group. The graph to the right shows the time-course (in 5-min intervals) for the pain-related responses in the same animals. B: Intracolonic capsaicin- (Caps) evoked visceral pain-related behaviors. The left graph shows the total number of behaviors during the observation time (30 min) in the different experimental groups. Each point represents an individual animal; the horizontal lines with errors correspond to the mean ± SEM. ***: P < 0.001 vs. respective non-capsaicin-treated control group. #: P < 0.05 vs. vehicle-Caps group. The graph to the right shows the time-course (in 5-min intervals) for the observation of pain-related behaviors in the same animals.

Figure 8. Effects of antibiotic treatment on colonic contractility assessed in vitro: basal contractility; contractile responses to NO-synthase inhibition with LNNA; Concentration-response curves to cholinergic stimulation with carbachol (CCh) and corresponding EC50s. Data are mean ± SEM, n = 5–6 per group, each point represents an individual animal (except for the concentration-response curves, where only mean ± SEM is shown). *: P < 0.05 vs. vehicle.
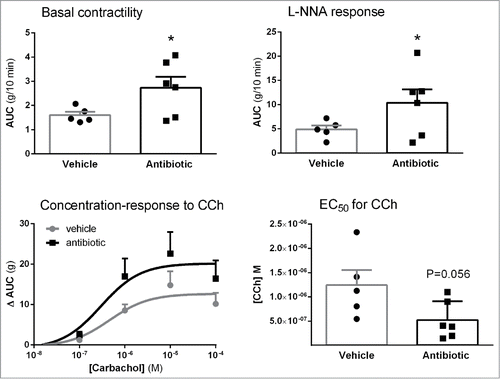
Figure 8. Effects of antibiotic treatment on colonic contractility assessed in vitro: basal contractility; contractile responses to NO-synthase inhibition with LNNA; Concentration-response curves to cholinergic stimulation with carbachol (CCh) and corresponding EC50s. Data are mean ± SEM, n = 5–6 per group, each point represents an individual animal (except for the concentration-response curves, where only mean ± SEM is shown). *: P < 0.05 vs. vehicle.

Table 2. Probes and primers used for bacterial identification (FISH and qPCR)

Reprints and Corporate Permissions

Please note: Selecting permissions does not provide access to the full text of the article, please see our help page How do I view content?

To request a reprint or corporate permissions for this article, please click on the relevant link below:

Academic Permissions

Please note: Selecting permissions does not provide access to the full text of the article, please see our help page How do I view content?

Obtain permissions instantly via Rightslink by clicking on the button below:

If you are unable to obtain permissions via Rightslink, please complete and submit this Permissions form. For more information, please visit our Permissions help page.