4,779
Views
65
CrossRef citations to date
0
Altmetric
RESEARCH PAPERS

Propionic acid and butyric acid inhibit lipolysis and de novo lipogenesis and increase insulin-stimulated glucose uptake in primary rat adipocytes

, &
Pages 81-88 | Received 08 Apr 2014, Accepted 28 Aug 2014, Published online: 14 Nov 2014

Figures & data

Figure 1. Short-chain fatty acids inhibit lipolysis in primary rat adipocytes. Lipolysis was measured after 30 min of stimulation with or without 30 nM isoproterenol (ISO), 10–30 U/ml adenosine deaminase (ADA) and 10 μM OPC3911 in the presence or absence of 3 and 10 mM propionic acid (PA) (A, B and E) or butyric acid (BA) (C-E). In A, C and E, the values are related to BASAL CTRL (condition without lipolytic agent and SCFA). In B and D, the values for PA and BA are related to respective CTRL (control without PA or BA) for each lipolytic condition. Mean ± SD (n = 5–13) were used and significance levels were accepted when *P < 0.05, **P < 0.01 and ***P < 0.001.
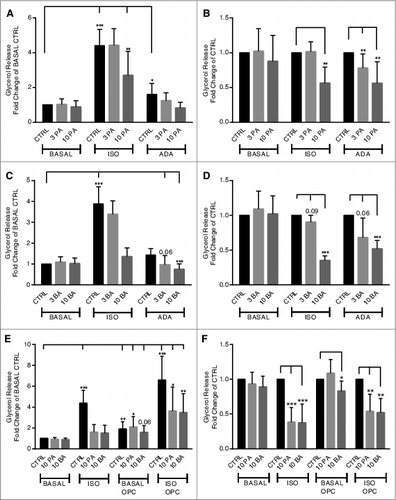
Figure 1. Short-chain fatty acids inhibit lipolysis in primary rat adipocytes. Lipolysis was measured after 30 min of stimulation with or without 30 nM isoproterenol (ISO), 10–30 U/ml adenosine deaminase (ADA) and 10 μM OPC3911 in the presence or absence of 3 and 10 mM propionic acid (PA) (A, B and E) or butyric acid (BA) (C-E). In A, C and E, the values are related to BASAL CTRL (condition without lipolytic agent and SCFA). In B and D, the values for PA and BA are related to respective CTRL (control without PA or BA) for each lipolytic condition. Mean ± SD (n = 5–13) were used and significance levels were accepted when *P < 0.05, **P < 0.01 and ***P < 0.001.

Figure 2. Short-chain fatty acids inhibit de novo lipogenesis in primary rat adipocytes. De novo lipogenesis was measured after 30 min of stimulation with or without 1 nM insulin (INS) in the presence or absence of 1, 3 and 10 mM propionic acid (PA) (A and B) or butyric acid (C and D). In A and C, the values are related to BASAL, condition without insulin and SCFA. In B and D, the values for PA and BA are related to CTRL (BASAL and INS are used as CTRL in respective group), either in a basal or an insulin-stimulated state. Mean ± SD (n = 3–6) were used and significance levels were accepted when *P < 0.05, **P < 0.01 and ***P < 0.001.
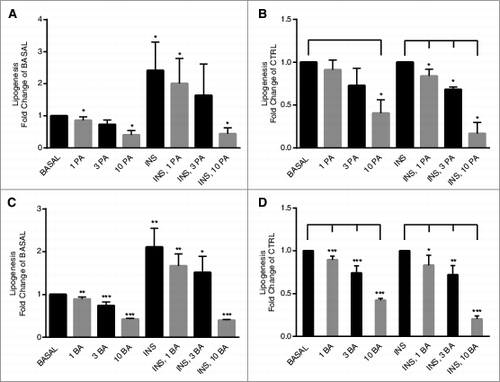
Figure 2. Short-chain fatty acids inhibit de novo lipogenesis in primary rat adipocytes. De novo lipogenesis was measured after 30 min of stimulation with or without 1 nM insulin (INS) in the presence or absence of 1, 3 and 10 mM propionic acid (PA) (A and B) or butyric acid (C and D). In A and C, the values are related to BASAL, condition without insulin and SCFA. In B and D, the values for PA and BA are related to CTRL (BASAL and INS are used as CTRL in respective group), either in a basal or an insulin-stimulated state. Mean ± SD (n = 3–6) were used and significance levels were accepted when *P < 0.05, **P < 0.01 and ***P < 0.001.

Figure 3. Short-chain fatty acids inhibit de novo lipogenesis via inhibition of ACC1. Primary rat adipocytes were stimulated with insulin (INS) in the presence or absence of 3 and 10 mM propionic acid (PA) and butyric acid (BA) for 10 min. In the CTRL, primary rat adipocytes were kept in a non-stimulatory condition. Homogenates were subjected to immunoblot analysis and membranes were probed for antibodies against ACC1 and phospho-ACC1 at serine 79 (S79). Quantification was made using Image Lab Software (Bio-Rad Laboratories) and data are presented as fold of insulin. Mean ± SD (n = 5–9) were used and significance levels were accepted when *P < 0.05, **P < 0.01 and ***P < 0.001.
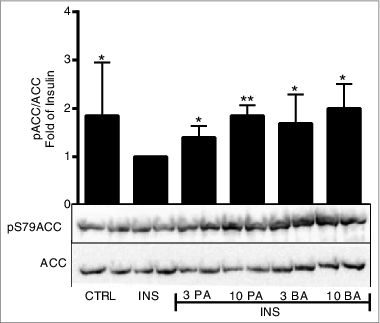
Figure 3. Short-chain fatty acids inhibit de novo lipogenesis via inhibition of ACC1. Primary rat adipocytes were stimulated with insulin (INS) in the presence or absence of 3 and 10 mM propionic acid (PA) and butyric acid (BA) for 10 min. In the CTRL, primary rat adipocytes were kept in a non-stimulatory condition. Homogenates were subjected to immunoblot analysis and membranes were probed for antibodies against ACC1 and phospho-ACC1 at serine 79 (S79). Quantification was made using Image Lab Software (Bio-Rad Laboratories) and data are presented as fold of insulin. Mean ± SD (n = 5–9) were used and significance levels were accepted when *P < 0.05, **P < 0.01 and ***P < 0.001.

Figure 4. Short-chain fatty acids potentiate insulin-stimulated glucose uptake in primary adipocytes. Glucose uptake was measured after 30 min of stimulation with or without 1 nM insulin (INS) in the presence or absence of 1, 3 and 10 mM propionic acid (PA) (A and B) or butyric acid (BA) (C and D). In A and C, the values are related to BASAL CTRL, the condition without insulin and SCFA. In B and D, the values are based upon the ratio between BASAL and INS-stimulated conditions (shown in A and C). Mean ± SD (n = 4–5) were used and significance levels were accepted when *P < 0.05, **P < 0.01 and ***P < 0.001.
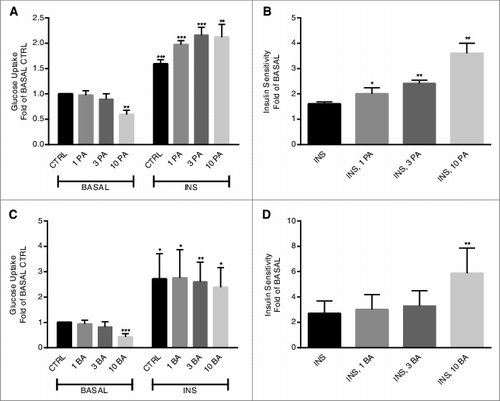
Figure 4. Short-chain fatty acids potentiate insulin-stimulated glucose uptake in primary adipocytes. Glucose uptake was measured after 30 min of stimulation with or without 1 nM insulin (INS) in the presence or absence of 1, 3 and 10 mM propionic acid (PA) (A and B) or butyric acid (BA) (C and D). In A and C, the values are related to BASAL CTRL, the condition without insulin and SCFA. In B and D, the values are based upon the ratio between BASAL and INS-stimulated conditions (shown in A and C). Mean ± SD (n = 4–5) were used and significance levels were accepted when *P < 0.05, **P < 0.01 and ***P < 0.001.